Placeholder canvas

Why Access Is One of the Most Important Factors in Getting Your House Sold!

Why Access Is One of the Most Important Factors in Getting Your House Sold! | Simplifying The Market

So, you’ve decided to sell your house. You’ve hired a real estate professional to help you through the entire process, and they have asked you what level of access you want to provide to your potential buyers.

There are four elements to a quality listing. At the top of the list is access, followed by condition, financing, and price. There are many levels of access that you can provide to your agent so that he or she can show your home.

Here are five levels of access that you can give to buyers, along with a brief description:

  1. Lockbox on the Door – this allows buyers the ability to see the home as soon as they are aware of the listing, or at their convenience.
  2. Providing a Key to the Home – although the buyer’s agent may need to stop by an office to pick up the key, there is little delay in being able to show the home.
  3. Open Access with a Phone Call – the seller allows showings with just a phone call’s notice.
  4. By Appointment Only (example: 48-Hour Notice) – Many buyers who are relocating for a new career or promotion start working in that area prior to purchasing their home. They often like to take advantage of free time during business hours (such as their lunch break) to view potential homes. Because of this, they may not be able to plan their availability far in advance or may be unable to wait 48 hours to see the house.
  5. Limited Access (example: the home is only available on Mondays or Tuesdays at 2 pm or for only a couple of hours a day) – This is the most difficult way to be able to show your house to potential buyers.

With more competition coming to the market this spring, access can make or break your ability to get the price you are looking for, or even sell your house at all.

The Cost of Renting vs. Buying This Spring [INFOGRAPHIC]

The Cost of Renting vs. Buying This Spring [INFOGRAPHIC] | Simplifying The Market

Some Highlights:

  • Historically, the choice between renting or buying a home has been a tough decision.
  • Looking at the percentage of income needed to rent a median-priced home today (27.7%) vs. the percentage needed to buy a median-priced home (17.5%), the choice becomes obvious.
  • Every market is different. Before you renew your lease again, find out if you can put your housing costs to work by buying this year!

Your Fabulous New Dream Home is Now Available

Your Fabulous New Dream Home is Now Available |Simplifying The Market

Over the last several years, many “baby boomers” have undergone a metamorphosis. Their children have finally moved out and they can now dream about their own future. For many, a change in lifestyle might necessitate a change in the type of home they live in.

That two-story, four-bedroom colonial with three bathrooms no longer fits the bill. Taxes are too high. Utilities are too expensive. Cleaning and repair are too difficult. When they decide to travel to be with friends and family, locking up the house is too time-consuming and worrisome.

Instead, a nice ranch home with 2-3 bedrooms and two baths might better fulfill their new needs and lifestyle. The challenge many “boomers” have faced when trying to downsize to the perfect new home has been a lack of inventory.

The average number of years a family stays in their home has increased by fifty percent since 2008, causing fewer houses to come to the market. During the same time, new home builders were concentrating most of their efforts on large, luxury, expensive houses.

However, that is starting to change.

According to the U.S. Department of Housing and Urban Development and the U.S. Census Bureau, sales of newly built, single-family homes rose to a seasonally adjusted annual rate of 692,000 units in March. The great news is that more of those homes were sold at the lower end of the price range.

In a press release last week, the National Association of Home Builders (NAHB) explained that:

“The median sales price was $302,700, with strong gains in homes sold at lower price points. The median price of a new home sale a year earlier was $335,400.”

NAHB Chief Economist Robert Dietz offered further detail:

“We saw a large gain at lower price points where demand is strong. In March of 2019, 50% of new home sales were priced below $300,000, compared to 39% in March of 2018.”

Bottom Line

If you are a “boomer” thinking of selling your old house in order to buy a new home that better fits your current lifestyle, now may be the perfect time!

2 Trends Helping Keep Housing Affordable

2 Trends Helping Keep Housing Affordable | Simplifying The Market

Two positive trends have started to emerge that impact the 2019 Spring Housing Market. Mortgage interest rates for a 30-year fixed rate loan have dropped to new lows, right as reports show that wages have increased at their highest rate in decades!

These two factors have helped keep housing affordable despite low supply of houses for sale driving up prices. First American’s Chief Economist, Mark Fleming, explains the impact,

“Ongoing supply shortages remain the main driver of the performance gap as the housing market continues to face an inventory impasse – you can’t buy what’s not for sale.

 However, an unexpected affordability surge, driven primarily by lower-than-anticipated mortgage rates, rising wages and favorable demographics, has boosted housing demand.”

Mortgage interest rates had been on the rise for most of 2018 before reaching their peak in November at 4.94%. According to Freddie Mac’s Primary Mortgage Market Survey, interest rates last week came in at 4.20%.

Average hourly earnings grew at an annual rate of 3.2% in March, up substantially from the 2.3% average pace seen over the last 10 years.

These two factors contributed nearly $6,000 worth of additional house-buying power for median households from February to March 2019, according to First American’s research. Fleming is positive about the prolonged impact of lower rates and higher wages.

“We expect rising wages and lower mortgage rates to continue through the spring, boosting housing demand and spurring home sales.”

Bottom Line

Low mortgage interest rates have kept housing affordable throughout the country. If you plan on purchasing a home this year, act now while rates are still low!


What Would Make You Sell Your House?

What Would Make You Sell Your House? | Simplifying The Market

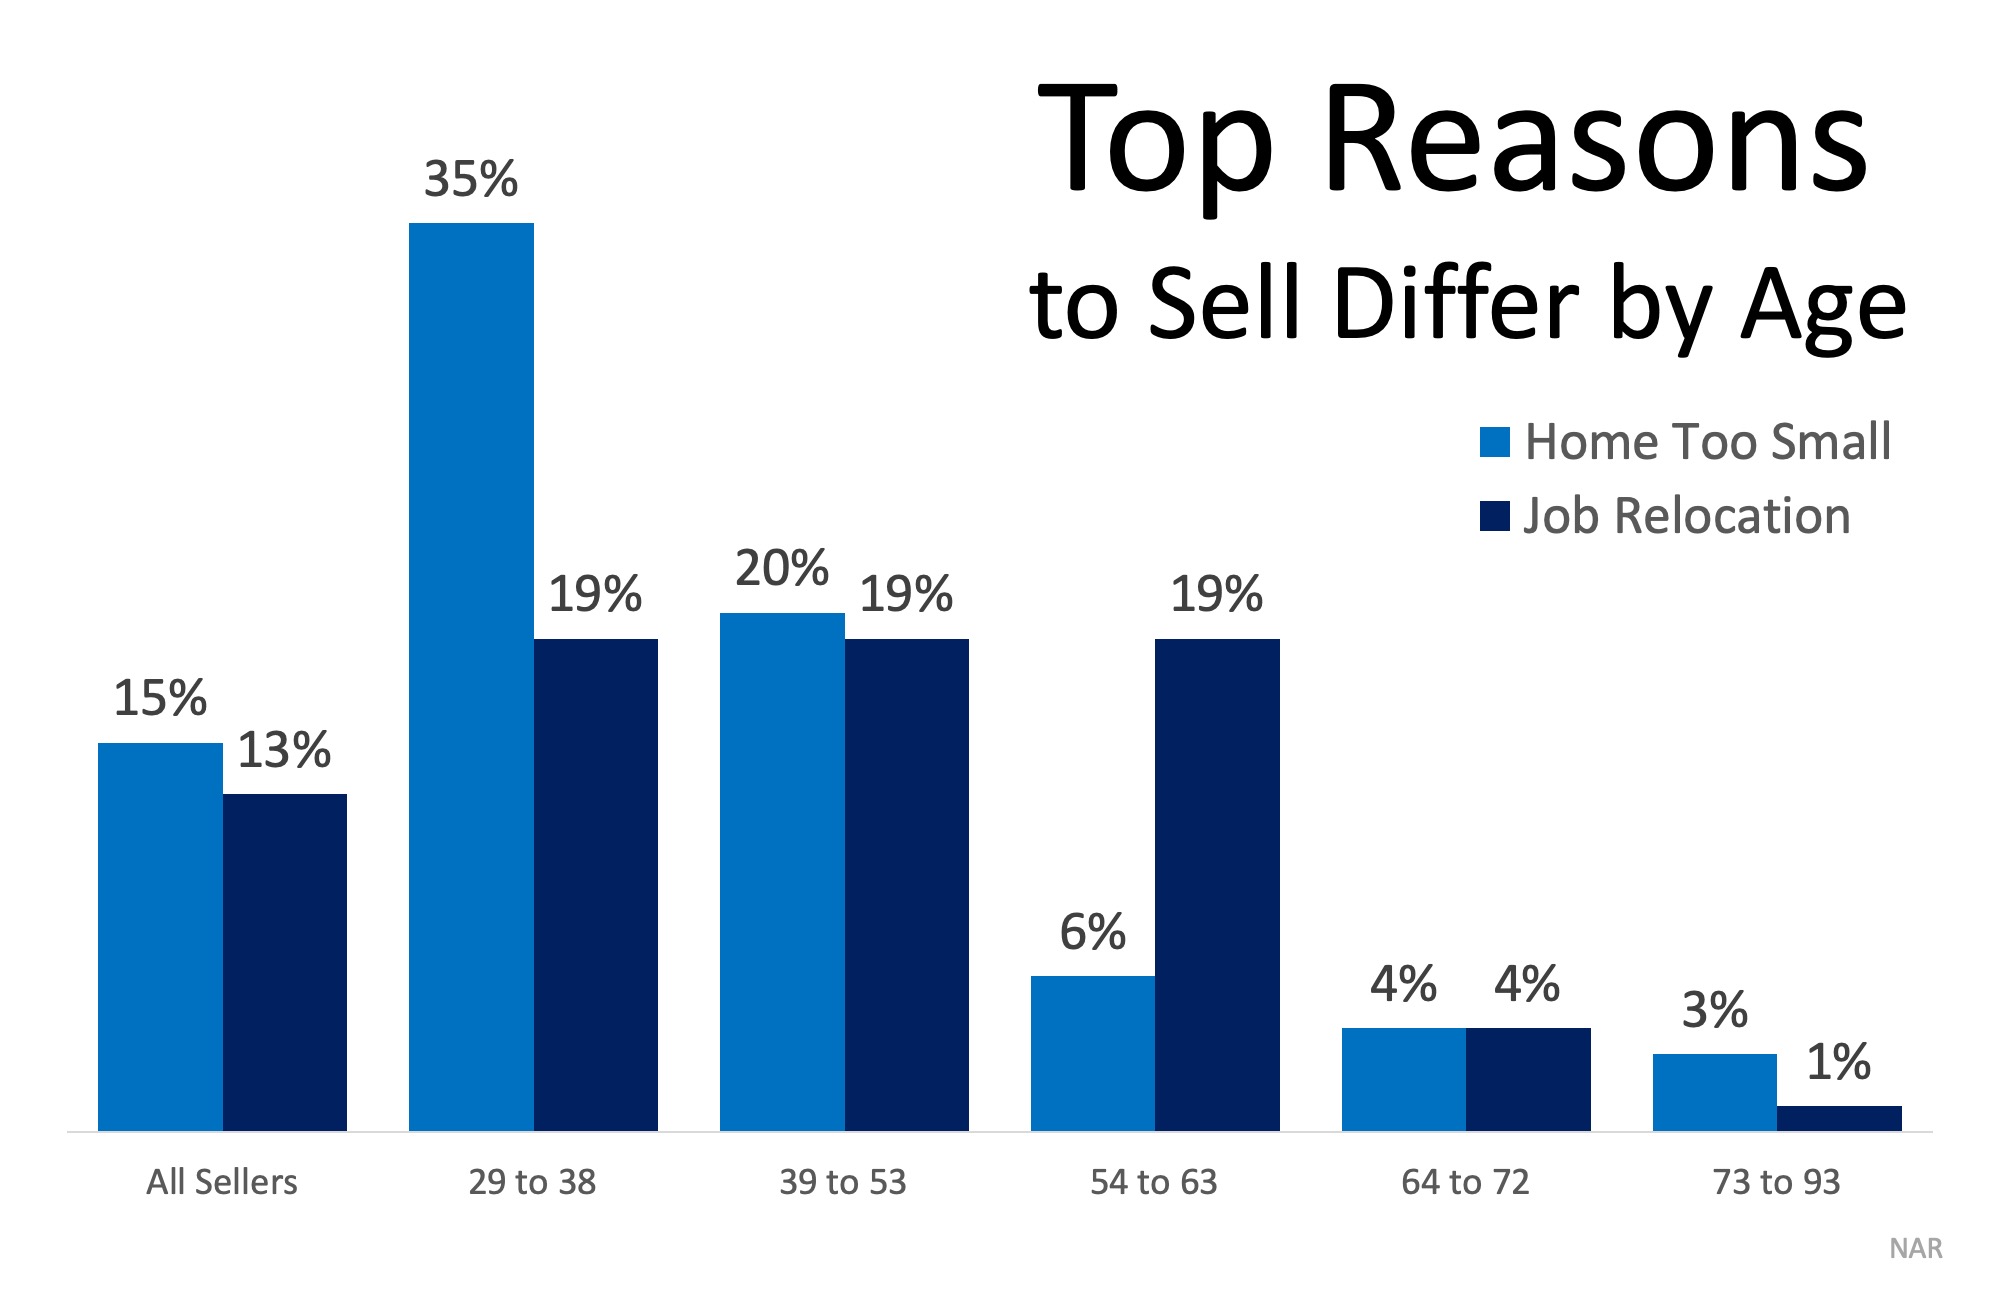
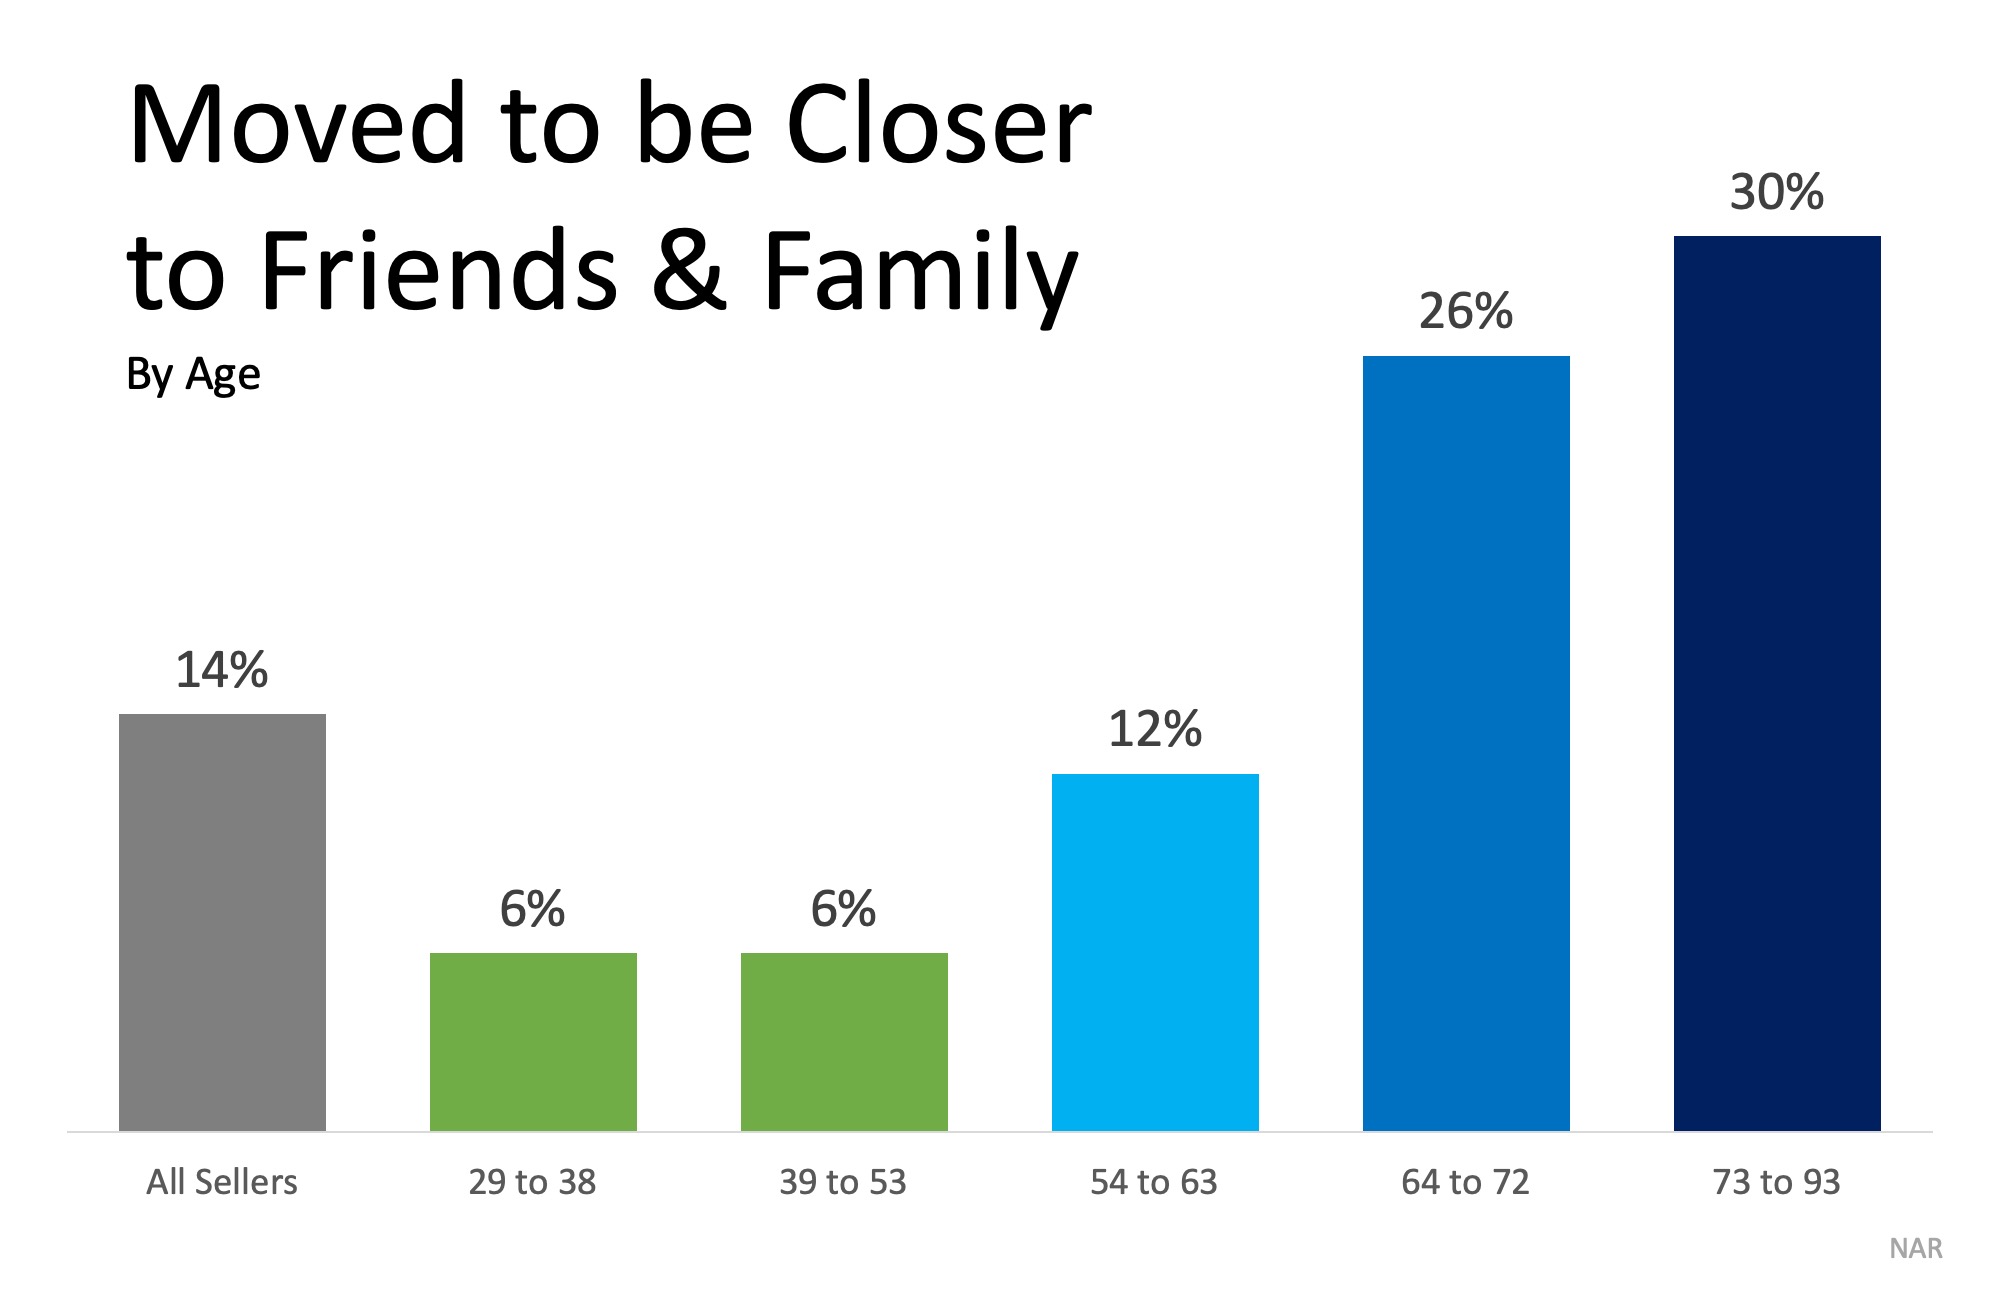
There are many reasons why a homeowner decides to sell their house and move. The latest Generational Trends Report from the National Association of Realtors asked recent home sellers to share their reason for moving.

The younger the respondents, the more likely their top response centered around needing a larger home (ages 29 to 53). Relocating for a job was the top reason for those ages 54 to 63 and the second most popular response for those under 53. The chart below shows the breakdown for these two reasons.

What Would Make You Sell Your House? | Simplifying The Market

For homeowners over the age of 64, wanting to be closer to friends and family served as the top motivator to move. Downsizing to a smaller home or moving due to retirement came in as a close second and third.

What Would Make You Sell Your House? | Simplifying The Market

Have you outgrown your current house? Are you a homeowner who can relate to wanting to be closer to family and friends? Is your house becoming a burden to clean now that the kids have moved out?

Bottom Line

Let’s get together to set you on the path to selling your current house and finding the home that fits your needs, today!

How Quickly Can You Save Your Down Payment?

How Quickly Can You Save Your Down Payment? | Simplifying The Market

Saving for a down payment is often the biggest hurdle for a first-time homebuyer. Depending on where you live, median income, median rents, and home prices all vary. So, we set out to find out how long it would take to save for a down payment in each state.

Using data from HUD, Census and Apartment List, we determined how long it would take, nationwide, for a first-time buyer to save enough money for a down payment on their dream home. There is a long-standing ‘rule’ that a household should not pay more than 28% of their income on their monthly housing expense.

By determining the percentage of income spent renting in each state, and the amount needed for a 10% down payment, we were able to establish how long (in years) it would take for an average resident to save enough money to buy a home of their own.

According to the data, residents in Kansas can save for a down payment the quickest, doing so in just over 1 year (1.12). Below is a map that was created using the data for each state:

How Quickly Can You Save Your Down Payment? | Simplifying The Market

What if you only needed to save 3%?

What if you were able to take advantage of one of Freddie Mac’s or Fannie Mae’s 3%-down programs? Suddenly, saving for a down payment no longer takes 2 to 5 years, but becomes possible in less than a year in most states, as shown on the map below.

How Quickly Can You Save Your Down Payment? | Simplifying The Market

Bottom Line

Whether you have just begun to save for a down payment or have been saving for years, you may be closer to your dream home than you think! Let’s get together to help you evaluate your ability to buy today.

Existing Home Sales Slow to Start Spring [INFOGRAPHIC]

Existing Home Sales Slow to Start Spring [INFOGRAPHIC] | Simplifying The Market

Existing Home Sales Slow to Start Spring [INFOGRAPHIC] | Simplifying The Market

Some Highlights:

  • Existing Home Sales slowed to an annual pace of 5.21 million home sales in March.
  • Low inventory levels are still impacting home sales! The current month’s supply of homes for sale is 3.9-months.
  • Median home prices were up 3.8% over last March at $259,400. This marked the 85th consecutive month with year-over-year price gains.

Renters Paying Substantially More While Owning Costs Less

Renters Paying Substantially More While Owning Costs Less | Simplifying The Market

In a recent Insights Blog, CoreLogic reported that rent prices have skyrocketed since 2005. Meanwhile, the typical mortgage payment has actually decreased.

“CoreLogic’s national rent index was up 36% in December 2018 compared with December 2005, while the typical mortgage payment was down 4% over that period.”

Renters Paying Substantially More While Owning Costs Less | Simplifying The Market

Why the difference between the costs of renting versus owning?

It makes sense that rents have risen. However, how did mortgage payments decrease? CoreLogic explained:

“It’s mainly because mortgage rates back in December 2005 were significantly higher, averaging 6.3% for a fixed-rate 30-year loan, compared with 4.6% in December 2018.

The national median sale price in December 2005 – $190,000 – was lower than the $220,305 median in December 2018, but because of higher mortgage rates in 2005 the typical monthly mortgage payment was slightly higher back then – $941 – compared with $904 in December 2018.”

Additionally, a recent report by the National Association of Realtors (NAR) showed that purchasing a home requires less of your monthly paycheck.

According to the Economists’ Outlook Blog, NAR’s February 2019 Housing Affordability Index showed that the “percentage of income needed” to pay the typical mortgage has decreased the last three months.

  • November – 17.3%
  • December – 16.9%
  • January – 16.2%
  • February – 15.9%

Bottom Line

What does this all mean to the current housing market? We think First American said it best in a post last week:

“The mortgage rate-driven affordability surge has arrived just in time… Rising affordability has already benefited home buyers and, if the lower rate environment persists, we’re in for a great spring home-buying season.”

New Study Reveals One Surprising Reason for the Inventory Shortage

New Study Reveals One Surprising Reason for the Inventory Shortage | Simplifying The Market

There has been a great amount written on millennials and their impact on the housing market. However, the headlines often contradict each other. Some claim this generation is becoming the largest share of first-time home buyers, while others claim millennials don’t want to own a home, blaming them for the dip in homeownership rate.

While it is true that millennials have achieved milestones like getting married, having kids, and buying homes later in life than their parents and grandparents did, they are not solely to blame for today’s housing market trends.

Freddie Mac’s Insight Report explored the impact of the Silent and Baby Boomer Generations on the housing market.

If millennials are unable to find a home to buy at a young age like their predecessors, then who is living in those homes?

The answer: Seniors born after 1931 are staying in their homes longer than previous generations, instead choosing to “age in place.”

Freddie Mac found that,

“this trend accounts for about 1.6 million houses held back from the market through 2018, representing about one year’s typical supply of new construction, or more than half of the current shortfall of 2.5 million housing units estimated in December’s Insight.

Older Americans prefer to age in place because they are satisfied with their communities, their homes, and their quality of life.”

According to the National Association of Realtors, inventory of homes for sale is currently at a 3.5-month supply, which means that nationally we are in a seller’s market. A ‘normal’ housing market requires 6-7 months inventory, a level we have not achieved since August 2012.

“The most important fundamental in today’s housing market is the lack of houses for sale. This shortage has been identified as an important barrier to young adults buying their first homes.”

Bottom Line

If you are one of the many seniors who desires to retire in the same area you’ve always lived, you’re not alone. Will your current house fit your needs throughout retirement? If you have any questions about demand for your house, let’s get together to discuss the opportunities available today!

With Inventory Low: Will Your Dream Home Need Some TLC?

With Inventory Low: Will Your Dream Home Need Some TLC? | Simplifying The Market

According to a new survey from Move.com, the wave of first-time homebuyers hitting the market this summer has resulted in an interesting statistic. Nearly 60% of buyers searching for a home this spring are willing to consider buying a fixer-upper, with 95% believing that the projects needed will increase their new home’s value!

Realtor.com’s Chief Economist, Danielle Hale, pointed to low-inventory at the entry-level price range for the increase in willingness to renovate.

“The combination of rising home prices and limited entry-level homes for sale is prompting many home shoppers to consider homes that need renovating.

Replete with inspiration at their fingertips – like Pinterest, Instagram, and various home renovation TV shows – some home shoppers are comfortable tackling home renovation jobs to find a home that balances their needs with their budget.”

Just over half of all respondents who said they would be willing to buy a home in need of some TLC, would also spend more $20,000 to make the home fit their needs.

The most common ‘expected’ renovation is a kitchen remodel which can run anywhere from $22,000 for a minor remodel to $66,000 for a major remodel.

This isn’t a new trend by any means. According to the Joint Center for Housing Studies at Harvard University, home improvement project spending reached a new high in 2018.

“Americans spent $336.9 billion on remodeling projects, up 7.4% from the $313.6 billion a year earlier.”

Home renovation television shows have given many buyers hope that they could renovate a home they can afford into their dream home!

Bottom Line

If you are one of the many Americans considering buying a home this spring, let’s get together to help you find a house with the potential to be your dream home!