Placeholder canvas

Buying a Home? Do You Know the Lingo? [INFOGRAPHIC]

Buying a Home? Do You Know the Lingo? [INFOGRAPHIC] | Simplifying The Market

Buying a Home? Do You Know the Lingo? [INFOGRAPHIC] | Simplifying The Market

Some Highlights:

  • Buying a home can be intimidating if you are not familiar with the terms used during the process.
  • To start you on your path with confidence, we have compiled a list of some of the most common terms used when buying a home.
  • The best way to ensure that your home-buying process is a confident one is to find a real estate professional who not only puts your family’s needs first, but will guide you through every aspect of the transaction with ‘the heart of a teacher.’

Dispelling the Myth About Home Affordability

Dispelling the Myth About Home Affordability | Simplifying The Market

We have all seen the headlines that report that buying a home is less affordable today than it was at any other time in the last ten years, and those headlines are accurate. But, have you ever wondered why the headlines don’t say the last 25 years, the last 20 years, or even the last 11 years?

The reason is that homes were less affordable 25, 20, or even 11 years ago than they are today.

Obviously, buying a home is more expensive now than during the ten years immediately following one of the worst housing crashes in American history.

Over the past decade, the market was flooded with distressed properties (foreclosures and short sales) that were selling at 10-50% discounts. There were so many distressed properties that the prices of non-distressed properties in the same neighborhoods were lowered and mortgage rates were kept low to help the economy.

Low Prices + Low Mortgage Rates = High Affordability

Prices have since recovered and mortgage rates have increased as the economy has gained strength. This has and will continue to impact housing affordability moving forward.

However, let’s give affordability some historical context. The National Association of Realtors (NAR) issues their Affordability Index each month. According to NAR:

“The Monthly Housing Affordability Index measures whether or not a typical family earns enough income to qualify for a mortgage loan on a typical home at the national and regional levels based on the most recent monthly price and income data.”

NAR’s current index stands at 138.8. The index had been higher each of the last ten years, peaking at 197 in 2012 (the higher the index the more affordable houses are).

But, the average index between 1990 and 2007 was just 123 and there were no years with an index above 133. That means that homes are more affordable today than at any time during the eighteen years between 1990 and 2007.

Bottom Line

With home prices continuing to appreciate and mortgage rates increasing, home affordability will likely continue to slide. However, this does not mean that buying a house is not an attainable goal in most markets as it is less expensive today than during the eighteen-year stretch immediately preceding the housing bubble and crash.

New Home Sales Up 12.7% From Last Year

New Home Sales Up 12.7% From Last Year | Simplifying The Market

According to the latest New Residential Sales Report from the Census Bureau, new construction sales in August were up 3.5% from July and 12.7% from last year! This marks the second consecutive month with double-digit year-over-year growth (12.8% in July).

The report also showed that builders have ramped up construction with an increase in new construction starts and completions. The summer months are often a busy time for builders as they capitalize on the warmer weather to be able to finish projects.

Below is a table showing the change in starts, completions, and sales from last August.

New Home Sales Up 12.7% From Last Year | Simplifying The Market

Other notable news from the report is that the percentage of new construction sales in the $200-$299k range has continued to break away from the $300-$399k range.

This shows that builders are starting to build lower-priced homes that will help alleviate some of the inventory challenges in the starter and trade-up home categories. The chart below shows the full breakdown.

New Home Sales Up 12.7% From Last Year | Simplifying The Market

What does this mean for buyers and sellers?

If you are thinking of buying or selling in today’s market, you no doubt have heard that there is a shortage of existing homes for sale which has been driving home prices up across the country. The additional new construction coming to the market could help alleviate this shortage, but we are still not back up to pre-crisis levels.

What’s Going On With Home Prices?

What’s Going On With Home Prices? | Simplifying The Market

According to CoreLogic’s latest Home Price Insights Report, national home prices in August were up 5.5% from August 2017. This marks the first time since June 2016 that home prices did not appreciate by at least 6.0% year-over-year.

CoreLogic’s Chief Economist Frank Nothaft gave some insight into this change,

“The rise in mortgage rates this summer to their highest level in seven years has made it more difficult for potential buyers to afford a home. The slackening in demand is reflected in the slowing of national appreciation, as illustrated in the CoreLogic Home Price Index.  

National appreciation in August was the slowest in nearly two years, and we expect appreciation to slow further in the coming year.”

One of the major factors that has driven prices to accelerate at a pace of between 6-7% over the past two years was the lack of inventory available for sale in many areas of the country. This made houses a prized commodity which forced many buyers into bidding wars and drove prices even higher.

According to the National Association of Realtors’ (NAR) latest Existing Home Sales Report, we are starting to see more inventory come to market over the last few months. This, paired with patient buyers who are willing to wait to find the right homes, is creating a natural environment for price growth to slow.

Historically, prices appreciated at a rate of 3.7% (from 1987-1999). CoreLogic predicts that prices will continue to rise over the next year at a rate of 4.7%.

Bottom Line

As the housing market moves closer to a ‘normal market’ with more inventory for buyers to choose from, home prices will start to appreciate at a more ‘normal’ level, and that’s ok! If you are curious about home prices in your area, let’s get together to chat about what’s going on!

The True Cost of NOT Owning Your Home

The True Cost of NOT Owning Your Home | Simplifying The Market

Owning a home has great financial benefits, yet many continue to rent! Today, let’s look at the financial reasons why owning a home of your own has been a part of the American Dream for the entirety of America’s existence.

Realtor.com reported that:

“Buying remains the more attractive option in the long term – that remains the American dream, and it’s true in many markets where renting has become really the shortsighted option…as people get more savings in their pockets, buying becomes the better option.”

What proof exists that owning is financially better than renting?

1. In a previous blog, we highlighted the top 5 financial benefits of homeownership:

  • Homeownership is a form of forced savings.
  • Homeownership provides tax savings.
  • Homeownership allows you to lock in your monthly housing cost.
  • Buying a home is cheaper than renting.
  • No other investment lets you live inside of it.

2. Studies have shown that a homeowner’s net worth is 44x greater than that of a renter.

3. Less than a month ago, we explained that a family that purchased an average-priced home at the beginning of 2018 could build more than $49,000 in family wealth over the next five years.

4. Some argue that renting eliminates the cost of taxes and home repairs, but every potential renter must realize that all the expenses the landlord incurs are already baked into the rent payment – along with a profit margin!

Bottom Line

Owning your home has many social and financial benefits that cannot be achieved by renting.

Buying a Home is Cheaper than Renting in 38 States! [INFOGRAPHIC]

Buying a Home is Cheaper than Renting in 38 States! [INFOGRAPHIC] | Simplifying The Market

Buying a Home is Cheaper than Renting in 38 States! [INFOGRAPHIC] | Simplifying The Market

Some Highlights:

  • According to a study by GOBankingRates, it is cheaper to buy a home than rent in 38 states across the country.
  • In six states the difference between buying & renting would account for less than a $50 monthly difference, leaving the choice up to the individual family.
  • Nationwide, it is now 26.3% cheaper to buy.

Are We About to Enter a Buyers’ Market?

Are We About to Enter a Buyers’ Market? | Simplifying The Market

Home sales are below last year’s levels, home values are appreciating at a slower pace, and there are reports showing purchasing demand softening. This has some thinking we may be entering a buyers’ market after sellers have had the upper hand for the past several years. Is this really happening?

The market has definitely softened. However, according to two chief economists in the industry, we are a long way from a market that totally favors the purchaser:

Dr. Svenja Gudell, Zillow Chief Economist:

“These seller challenges don’t indicate we’re suddenly in a buyers’ market – we don’t expect market conditions to shift decidedly in favor of buyers until 2020 or later. But buyers certainly are starting to balk at the rapid rise in prices and home values are starting to grow at a less frenetic pace.”

Danielle Hale, Chief Economist of realtor.com:

“The signs are pointing to a market that’s shifting toward buyers. But, in most places, we’re still a long way from a full reversal.”

In addition, Pulsenomics Inc. recently surveyed over one hundred economists, real estate experts, and investment & market strategists and asked this question:

“When do you expect U.S. housing market conditions to shift decidedly in favor of homebuyers?”

Only 5% said the market has already shifted. Here are the rest of the survey results:

Are We About to Enter a Buyers’ Market? | Simplifying The Market

Bottom Line

The market is beginning to normalize but that doesn’t mean we will quickly shift to a market favoring the buyer. We believe Ivy Zelman, author of the well-respected ‘Z’ Report, best explained the current confusion:

“With the rate of home price appreciation starting to decelerate alongside the uptick in inventory…we expect significant debate about whether this is a bullish or bearish sign.

In our view, the short-term narrative will probably be confusing, but more sustainable growth and affordability will likely be the end result.”

2 Factors to Watch in Today’s Real Estate Market Whether Buying or Selling

2 Factors to Watch in Today’s Real Estate Market Whether Buying or Selling | Simplifying The Market

When it comes to buying or selling a home there are many factors you should consider. Where you want to live, why you want to buy or sell, and who will help you along your journey are just some of those factors. When it comes to today’s real estate market, though, the top two factors to consider are what’s happening with interest rates & inventory.

Interest Rates

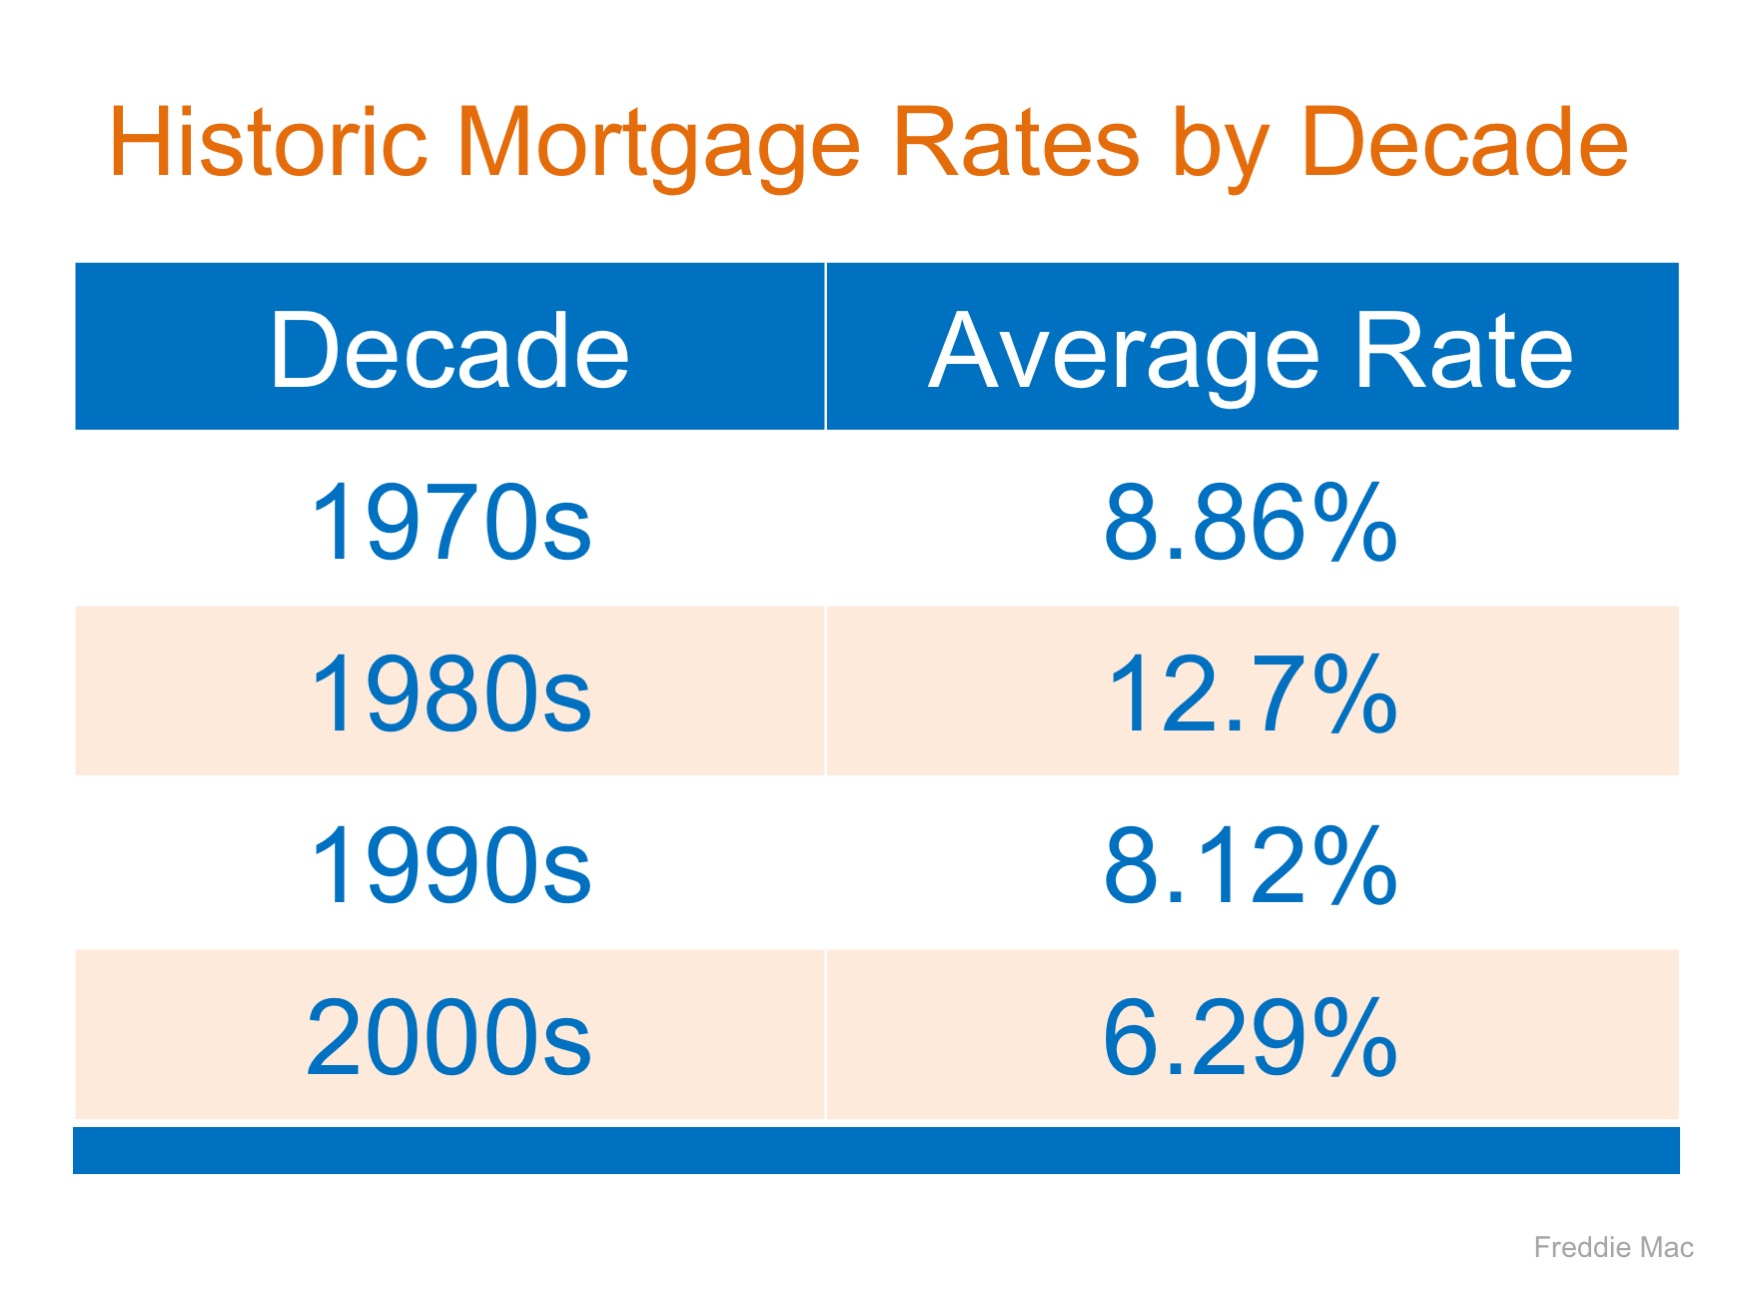
Mortgage interest rates have been on the rise and are now over three-quarters of a percentage point higher than they were at the beginning of the year. According to Freddie Mac’s latest Primary Mortgage Market Survey, rates climbed to 4.72% for a 30-year fixed rate mortgage last week.

The interest rate you secure when buying a home not only greatly impacts your monthly housing costs, but also impacts your purchasing power.

Purchasing power, simply put, is the amount of home you can afford to buy for the budget you have available to spend. As rates increase, the price of the house you can afford to buy will decrease if you plan to stay within a certain monthly housing budget.

The chart below shows the impact that rising interest rates would have if you planned to purchase a $400,000 home while keeping your principal and interest payments between $2,020-$2,050 a month.

2 Factors to Watch in Today’s Real Estate Market Whether Buying or Selling | Simplifying The Market

With each quarter of a percent increase in interest rate, the value of the home you can afford decreases by 2.5% (in this example, $10,000). Experts predict that mortgage rates will be over 5% by this time next year.

Inventory

A ‘normal’ real estate market requires there to be a 6-month supply of homes for sale in order for prices to increase only with inflation. According to the National Association of Realtors (NAR), listing inventory is currently at a 4.3-month supply (still well below the 6-months needed), which has put upward pressure on home prices. Home prices have increased year-over-year for the last 78 straight months.

The inventory of homes for sale in the real estate market had been on a steady decline and experienced year-over-year drops for 36 straight months (from July 2015 to May 2018), but we are starting to see a shift in inventory over the last three months.

The chart below shows the change in housing supply over the last 12 months compared to the previous 12 months. As you can see, in June, July, and August, inventory levels have started to increase as compared to the same time last year.

2 Factors to Watch in Today’s Real Estate Market Whether Buying or Selling | Simplifying The Market

This is a trend to watch as we move further into the fall and winter months. If we continue to see an increase in homes for sale, we could start moving further away from a seller’s market and closer to a normal market.

Bottom Line

If you are planning to enter the housing market, either as a buyer or a seller, let’s get together to discuss the changes in mortgage interest rates and inventory and what they could mean for you.

Mortgage Interest Rates are Still Going Up… Should You Wait to Buy?

Mortgage Interest Rates are Still Going Up… Should You Wait to Buy? |Simplifying The Market

Mortgage interest rates, as reported by Freddie Mac, have increased by close to a quarter of a percent over the last several weeks. Freddie Mac, Fannie Mae, the Mortgage Bankers Association, and the National Association of Realtors are all calling for mortgage rates to rise another quarter of a percent by next year.

In addition to the predictions from the four major reporting agencies mentioned above, the Federal Open Market Committee recently voted “unanimously to approve a 1/4 percentage point increase in the primary credit rate to 2.75 percent.” Historically, an increase in the primary credit rate has translated to an overall jump in mortgage interest rates as well.

This has caused some purchasers to lament the fact that they may no longer be able to get a rate below 4%. However, we must realize that current rates are still at historic lows.

Here is a chart showing the average mortgage interest rate over the last several decades:

Mortgage Interest Rates are Still Going Up… Should You Wait to Buy? |Simplifying The Market

Bottom Line

Though you may have missed the lowest mortgage rate ever offered, you can still get a better interest rate than your older brother or sister did ten years ago, a lower rate than your parents did twenty years ago, and a better rate than your grandparents did forty years ago.