Placeholder canvas

4 Quick Reasons NOT to Fear a Housing Crash

There is a lot of uncertainty regarding the real estate market heading into 2019. That uncertainty has raised concerns that we may be headed toward another housing crash like the one we experienced a decade ago.

Here are four reasons why today’s market is much different:

1. There are fewer foreclosures now than there were in 2006

A major challenge in 2006 was the number of foreclosures. There will always be foreclosures, but they spiked by over 100% prior to the crash. Foreclosures sold at a discount and, in many cases, lowered the values of adjacent homes. We are ending 2018 with foreclosures at historic pre-crash numbers – much fewer foreclosures than we ended 2006 with.

4 Quick Reasons NOT to Fear a Housing Crash | Simplifying The Market

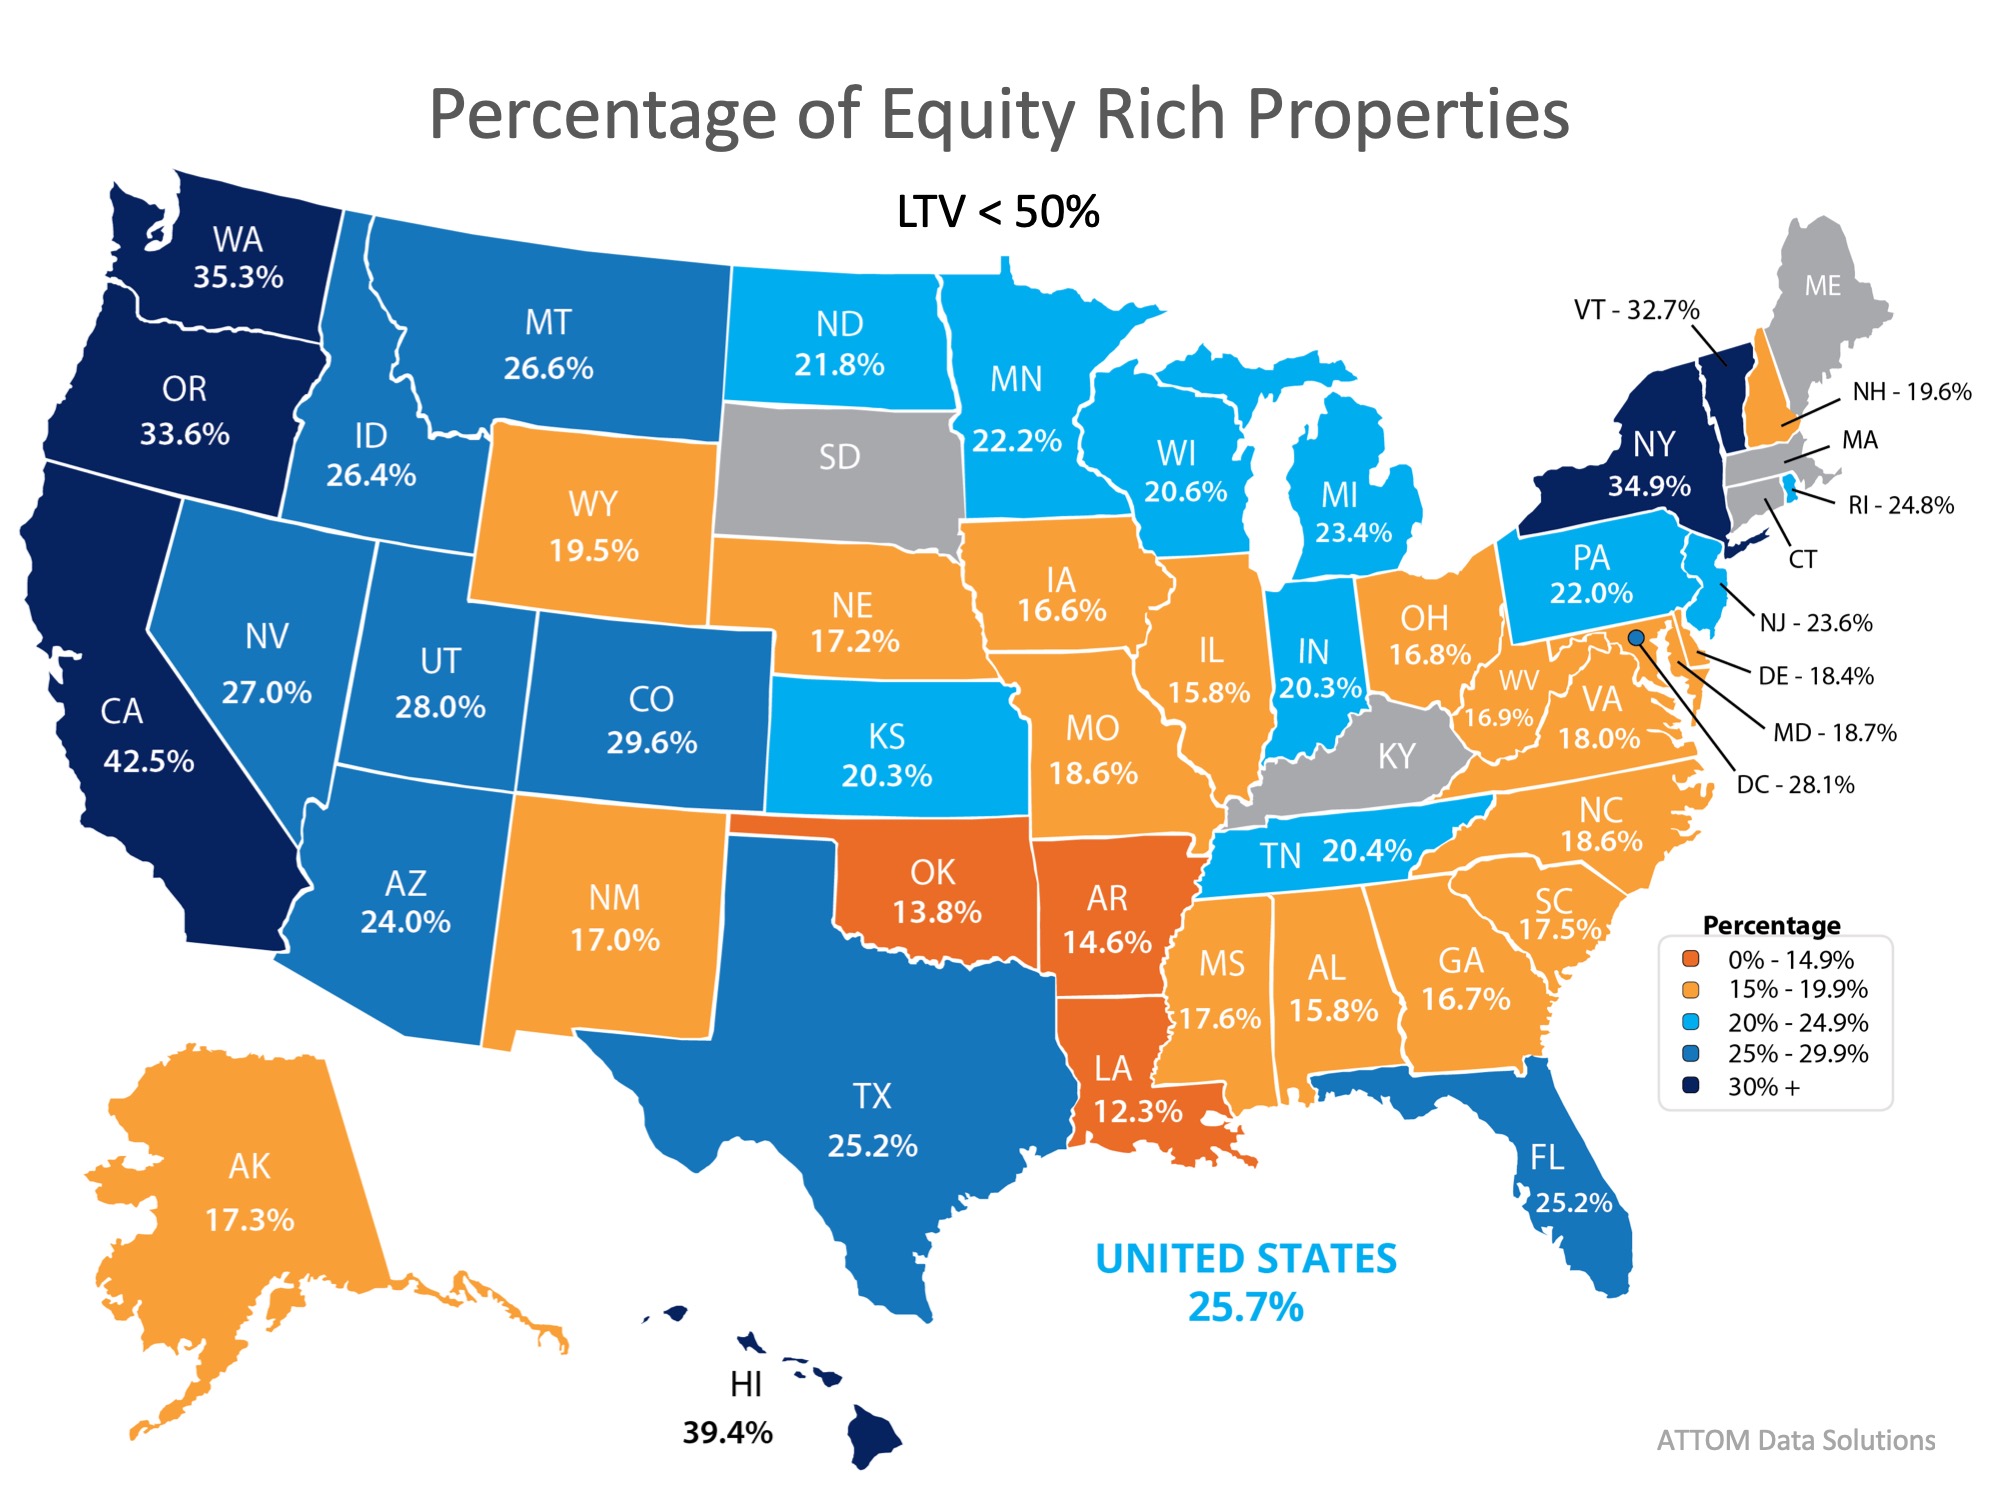
2. Most homeowners have tremendous equity in their homes

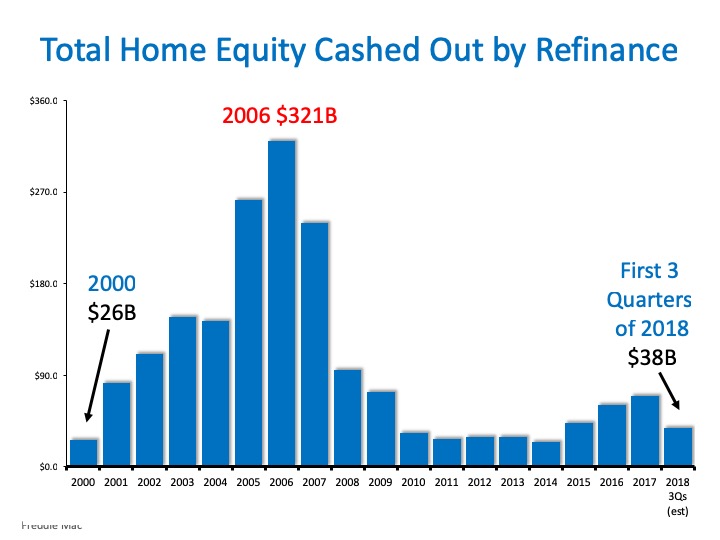
Ten years ago, many homeowners irrationally converted much, if not all, of their equity into cash with a cash-out refinance. When foreclosures rose and prices fell, they found themselves in a negative equity situation where their homes were worth less than their mortgage amounts. Many just walked away from their houses which led to even more foreclosures entering the market. Today is different. Over forty-eight percent of homeowners have at least 50% equity in their homes and they are not extracting their equity at the same rates they did in 2006.

4 Quick Reasons NOT to Fear a Housing Crash | Simplifying The Market

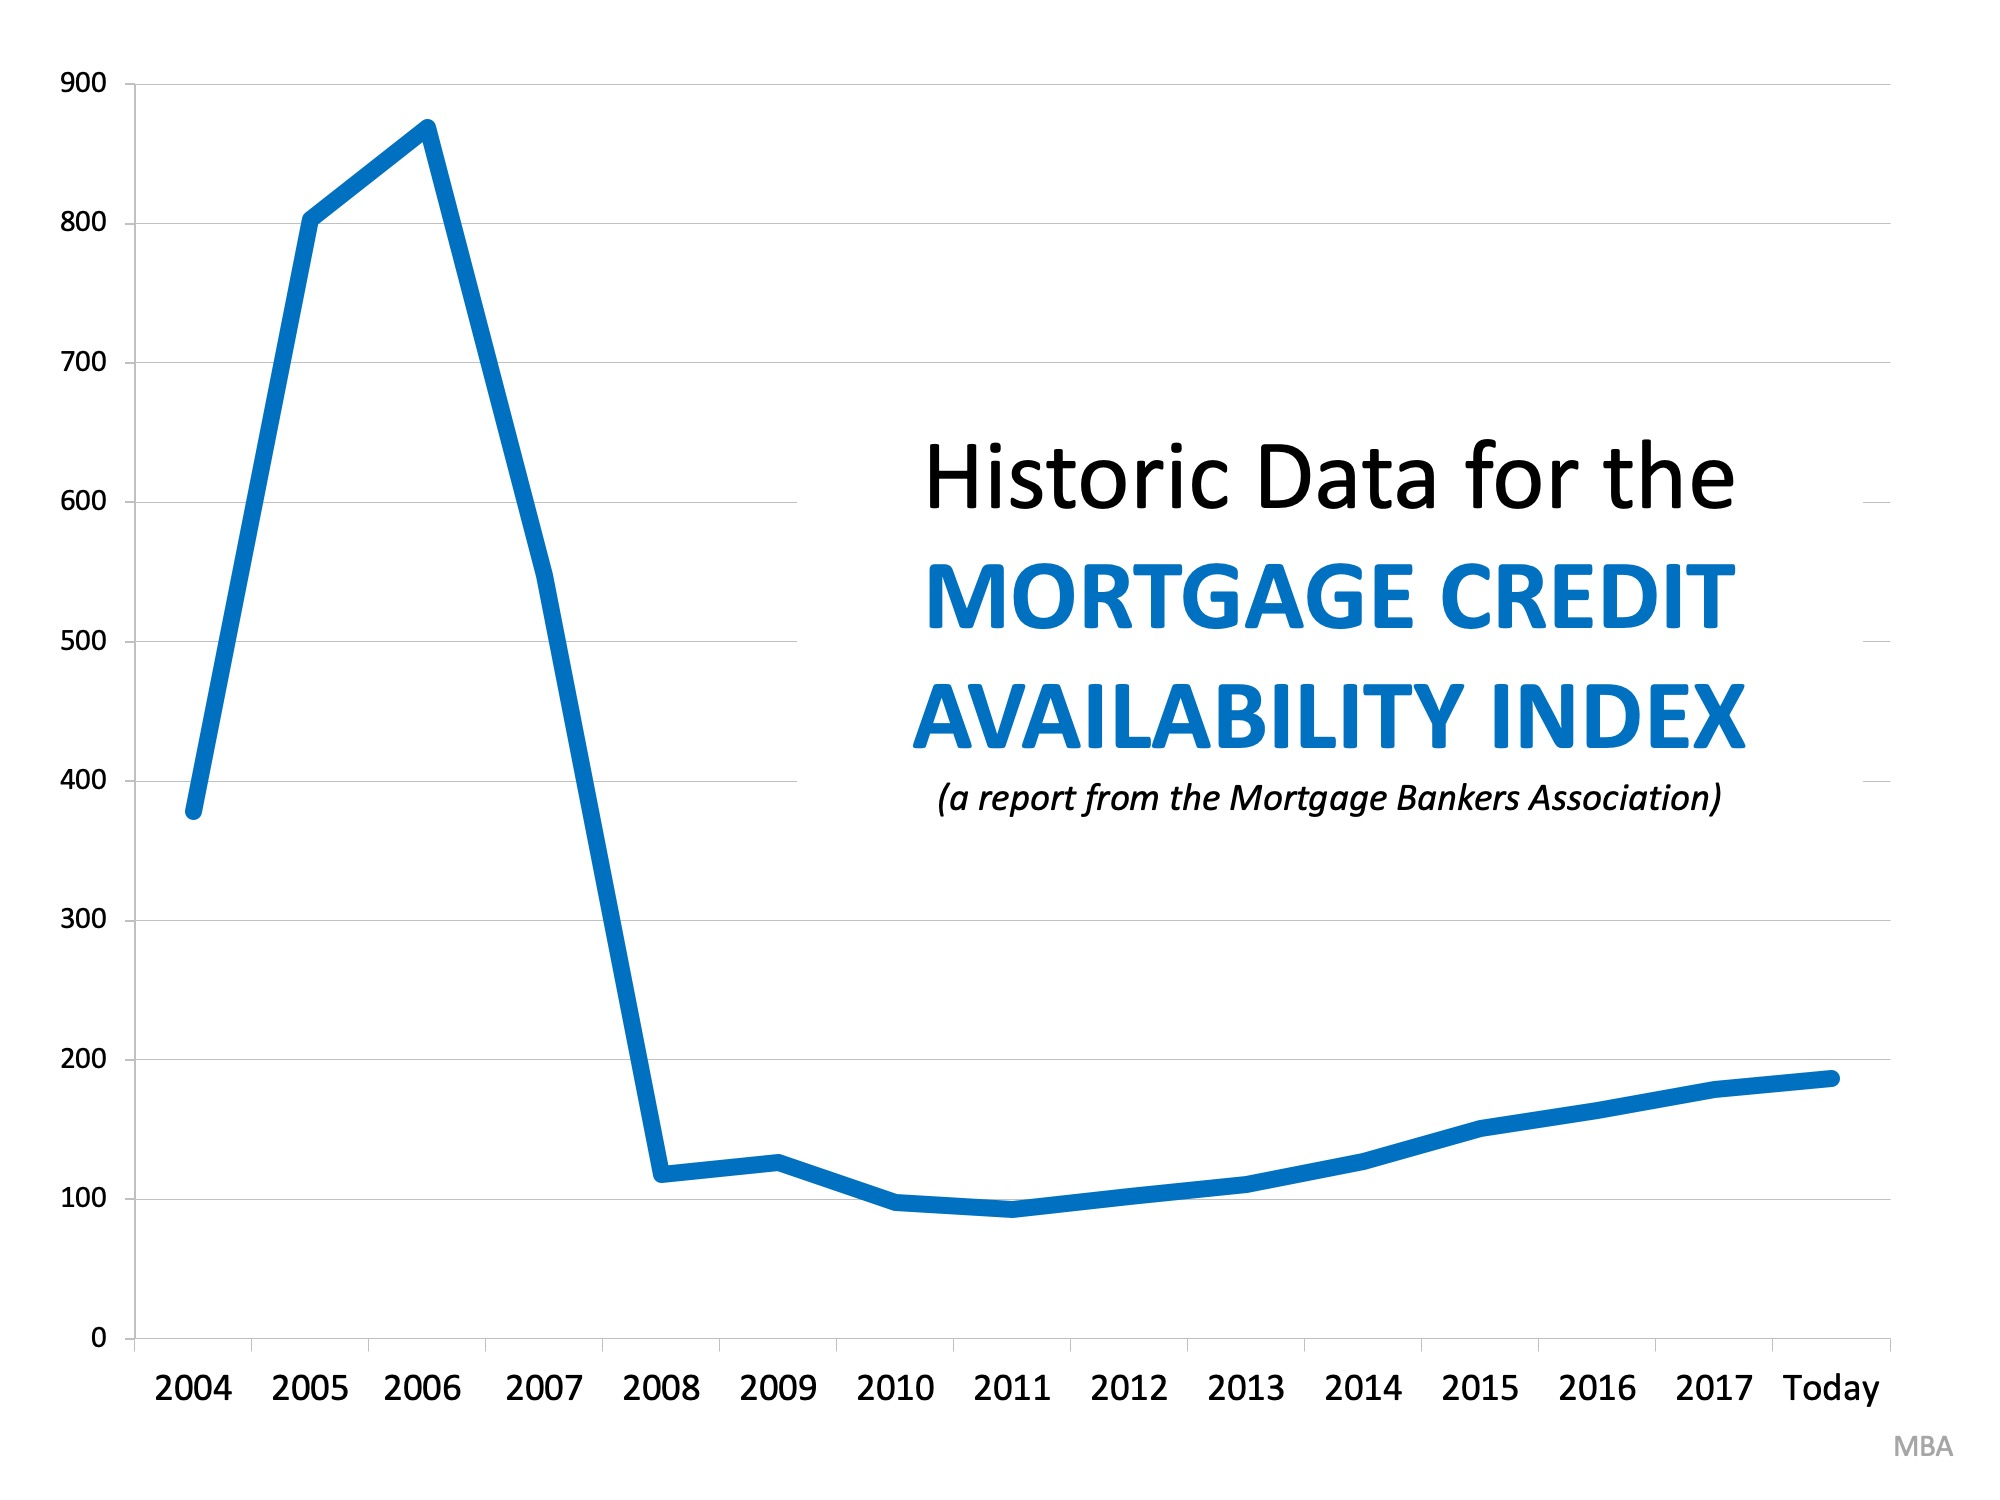
3. Lending standards are much tougher

One of the causes of the crash ten years ago was that lending standards were almost non-existent. NINJA loans (no income, no job, and no assets) no longer exist. ARMs (adjustable rate mortgages) still exist but only as a fraction of the number from a decade ago. Though mortgage standards have loosened somewhat during the last few years, we are nowhere near the standards that helped create the housing crisis ten years ago.

4 Quick Reasons NOT to Fear a Housing Crash | Simplifying The Market

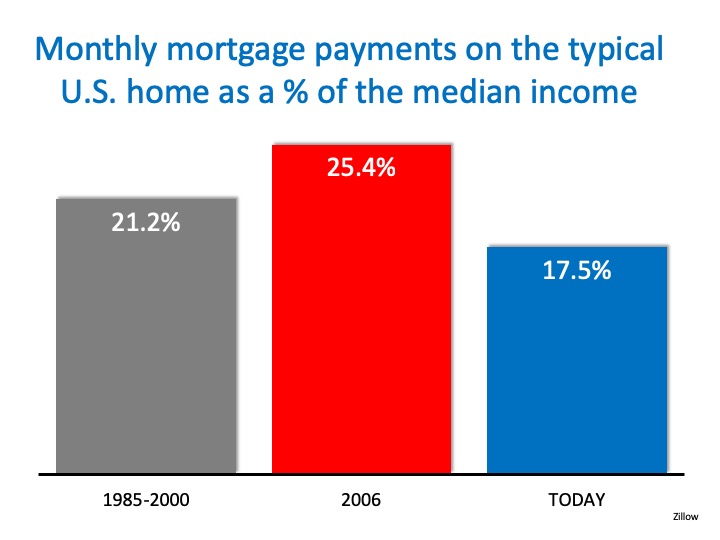
4. Affordability is better now than in 2006

Though it is difficult to afford a home for many Americans, data shows that it is more affordable to purchase a home now than it was from 1985 to 2000. And, it requires much less of a percentage of your income today than it did in 2006.

4 Quick Reasons NOT to Fear a Housing Crash | Simplifying The Market

Bottom Line

The housing industry is facing some rough waters heading into 2019. However, the graphs above show that the market is much healthier than it was prior to the crash ten years ago.

Homeownership Remains a Huge Part of the American Dream

Homeownership Remains a Huge Part of the American Dream | Simplifying The Market

As we head into 2019, many news outlets and housing experts warn that the housing market may slow down. Over the last six years, the inventory of homes for sale has been near historic lows, which has been the force behind increasing home prices.

This has been great news for sellers as many of them have been able to capitalize on the demand in the market and sell their homes quickly and at a great profit.

One of the big reasons why inventory has remained so low for so long is that an entire generation of home buyers is finally buying! The millennial generation (ages 19-35) has been the driving force behind bidding wars in many areas of the country as they ditch their renter lifestyles and put down roots in new communities.

First American recently released a study entitled “How ‘Renter’ Millennials Will Transform the Housing Market.” In their study, they explained that:

“…As more millennials age into their early-to-mid thirties, and begin to get married, have children and form households, they will continue to be the primary drivers of homeownership demand.”

Because of this, it is safe to say that one aspect of 2019’s housing market that WILL NOT slow down is the demand for housing from young renters who are no longer satisfied living in someone else’s homes.

According to the latest Housing Vacancies and Homeownership Report from the Census Bureau, home buyers under 35 are already out-buying older Americans. The chart below shows the year-over-year change in homeownership rate by those under and over the age of 35.

Homeownership Remains a Huge Part of the American Dream | Simplifying The Market

The national homeownership rate spiked to its highest level in 2004 and then steadily declined until the second quarter of 2016 when it reversed course. Homebuyers under the age of 35 are the reason for that shift.

More than half of the purchase mortgages originated by Fannie Mae and Freddie Mac in 2018 were to first-time homebuyers. In fact,

“according to Census Bureau and First American calculations, over the next 10 years, aging millennials are expected to purchase at least 10 million new homes. By 2060, it is estimated millennials will have produced more than 20 million first-time home buyers.”

Bottom Line

If you are a homeowner who is nervous that the demand for your home will slow, don’t worry! If your home is priced competitively, there will be demand for years to come as this generation of renters is finally able to buy!

No Bubble Here! How New Mortgage Standards Are Helping

No Bubble Here! How New Mortgage Standards Are Helping | Simplifying The Market

Real estate is shifting to a more normal market; the days of national home appreciation topping 6% annually are over and inventories are increasing which is causing bidding wars to almost disappear. Some see these as signs that the market will soon come tumbling down as it did in 2008.

As it becomes easier for buyers to obtain mortgages, many are suggesting that this is definite proof that banks are repeating the same mistakes they made a decade ago. Today, we want to assure everyone that we are not heading to another housing “bubble & bust.”

Each month, the Mortgage Bankers’ Association (MBA) releases a measurement which indicates the availability of mortgage credit known as the Mortgage Credit Availability Index (MCAI). According to the MBA:

“The MCAI provides the only standardized quantitative index that is solely focused on mortgage credit. The MCAI is calculated using several factors related to borrower eligibility (credit score, loan type, loan-to-value ratio, etc.).” *

The higher the measurement, the easier it is to get a mortgage. During the buildup to the last housing bubble, the measurement sat at around 400. In 2005 and 2006, the measurement more than doubled to over 800 and was still at almost 600 in 2007. When the market crashed in 2008, the index fell to just over 100.

Over the last decade, as credit began to ease, the index increased to where it is today at 186.7 – still less than half of what it was prior to the buildup of last decade and less than one-quarter of where it was during the bubble.

Here is a graph depicting this information (remember, the higher the index, the easier it was to get a mortgage):

No Bubble Here! How New Mortgage Standards Are Helping | Simplifying The Market

Bottom Line

Though mortgage standards have loosened somewhat during the last few years, we are nowhere near the standards that helped create the housing crisis ten years ago.

*For more information on the MCAI, including methodology, FAQs, and other helpful resources, please click here.

What If I Wait A Year to Buy a Home?

What If I Wait Until 2019 To Buy A Home? | Simplifying The Market

National home prices have increased by 5.4% since this time last year. Over that same time period, interest rates have remained near historic lows which has allowed many buyers to enter the market and lock in low rates.

As a seller, you will likely be most concerned about ‘short-term price’ – where home values are headed over the next six months. As a buyer, however, you must not be concerned about price but instead about the ‘long-term cost’ of the home.

The Mortgage Bankers Association (MBA), Freddie Mac, and Fannie Mae all project that mortgage interest rates will increase by this time next year. According to CoreLogic’s most recent Home Price Insights Reporthome prices will appreciate by 4.8% over the next 12 months.

What Does This Mean as a Buyer?

If home prices appreciate by 4.8% over the next twelve months as predicted by CoreLogic, here is a simple demonstration of the impact that an increase in interest rate would have on the mortgage payment of a home selling for approximately $250,000 today:

What If I Wait Until 2019 To Buy A Home? | Simplifying The Market

Bottom Line

If buying a home is in your plan for this year, doing it sooner rather than later could save you thousands of dollars over the terms of your loan.

The Tale of Two Markets [INFOGRAPHIC]

The Tale of Two Markets [INFOGRAPHIC] | Simplifying The Market

The Tale of Two Markets [INFOGRAPHIC] | Simplifying The Market

Some Highlights:

  • An emerging trend for some time now has been the difference between available inventory and demand in the premium and luxury markets and that in the starter and trade-up markets and what those differences are doing to prices!
  • Inventory continues to rise in the luxury and premium home markets which is causing prices to cool.
  • Demand continues to rise with lower-than-normal inventory levels in the starter and trade-up home markets, causing prices to rise on a year-over-year basis for 80 consecutive months.

2008 vs. Now: Are Owners Using Their Homes as ATMs Again?

2008 vs. Now: Are Owners Using Their Homes as ATMs Again? | Simplifying The Market

Over the last six years, we have experienced strong price appreciation which has increased home equity levels dramatically. As the number of “cash-out” refinances begins to approach numbers last seen during the crash, some are afraid that we may be repeating last decade’s mistake.

However, a closer look at the numbers shows that homeowners are being much more responsible with their home equity this time around.

What happened then…

When real estate values began to surge last decade, people started using their homes as personal ATMs. Homeowners would refinance their houses and convert their equity into instant cash (known as “cash-out” refinances). Because homes were appreciating so rapidly, many homeowners tapped into their equity multiple times.

This left homeowners with little-or-no equity left in their homes, so when prices started to fall many homeowners found their houses in a negative equity situation (where the mortgage amount was greater than the value of the home). When some of these homeowners saw that there was no value left in their houses, they just stopped paying their mortgages altogether.

Banks eventually foreclosed on those homes and the foreclosures drove prices down even further and put more homes in the negative equity category. This cycle continued, leading to the worst housing crash in almost one hundred years.

What’s happening now…

Again, Americans are seeing their home equity grow. Today, over 48% of all single-family homes in the country have over 50% equity, and yes, some families are tapping into that equity. However, this time around, homeowners are not doing making irresponsible decisions. According to the latest information from Freddie Mac, the total equity being “cashed out” is a fraction of what it was leading up to the crash. Here are the numbers:

2008 vs. Now: Are Owners Using Their Homes as ATMs Again? | Simplifying The Market

Bottom Line

The recklessness that accompanied the build-up in equity prior to the last crash does not exist today. That makes this housing market much more secure than the one we had heading into 2008.

Homeowners Aged 65+ Have 48x More Net Worth Than Renters

Homeowners Aged 65+ Have 48x More Net Worth Than Renters | Simplifying The Market

Every three years, the Federal Reserve conducts their Survey of Consumer Finances in which they collect data across all economic and social groups. Their latest survey data covers responses from 2013-2016.

The study revealed that the median net worth of a homeowner was $231,400 – a 15% increase since 2013. At the same time, the median net worth of renters decreased by 5% ($5,200 today compared to $5,500 in 2013).

These numbers reveal that the net worth of a homeowner is over 44 times greater than that of a renter.

There are many who see that statistic and point toward how broad the range of respondents are for the Federal Reserve survey. Their study includes all economic and social groups and also includes all age groups. The argument is that older respondents have a higher likelihood of being homeowners, while the homeownership rate among younger survey takers is much lower.

Recently, the Joint Center for Housing Studies at Harvard University focused on homeowners and renters over the age of 65. Their study revealed that the difference in net worth between homeowners and renters at this age group was actually 47.5 times greater!

Homeowners Aged 65+ Have 48x More Net Worth Than Renters | Simplifying The Market

Homeowners over the age of 65 are much more financially prepared for retirement and often own their homes outright if they were fortunate enough to purchase their homes before the age of 36. Their 30 years of mortgage payments have paid off as they gained equity through their monthly payments and as home values appreciated.

It is no surprise that lifelong-renters have had a hard time accruing net worth as the latest Census report shows that the Median Asking Rent has been climbing consistently over the last 30 years.

Homeowners Aged 65+ Have 48x More Net Worth Than Renters | Simplifying The Market

Bottom Line

As a homeowner you put your monthly mortgage payment to work for you, building your net worth with every payment.

Further Proof It’s NOT 2008 All Over Again

Further Proof It’s NOT 2008 All Over Again | Simplifying The Market

Home sales numbers are leveling off, the rate of price appreciation has slowed to more historically normal averages, and inventory is finally increasing. We are headed into a more normal housing market.

However, some are seeing these adjustments as red flags and are suggesting that we are headed back to the same challenges we experienced in 2008. Today, let’s look at one set of statistics that prove the current market is nothing like the one that preceded the housing crash last decade.

The previous bubble was partially caused by unhealthy levels of mortgage debt. New purchasers were putting down the minimum down payment, resulting in them having little if any equity in their homes.

Existing homeowners were using their homes as ATMs by refinancing and swapping their equity for cash. When prices started to fall, many homeowners found themselves in a negative equity situation (where their mortgage was higher than the value of their home) so they walked away which caused prices to fall even further. When this happened, even more homeowners found themselves in negative equity situations which caused them to walk away as well, and so a vicious cycle formed.

Today, the equity situation is totally different. According to a new report from ATTOM Data Solutions more than 1-in-4 homes with a mortgage have at least 50% equity. The report explains:

“…nearly 14.5 million U.S. properties were equity rich — where the combined estimated amount of loans secured by the property was 50 percent or less of the property’s estimated market value…The 14.5 million equity rich properties in Q3 2018 represented 25.7 percent of all properties with a mortgage.”

In addition, according to the U.S. Census Bureau, 30.3% of homes in the country have no mortgage on them.

Further Proof It’s NOT 2008 All Over Again | Simplifying The Market

Almost 50% of all homes have at least 50% equity.

If we take both numbers, the 30.3% of all homes without a mortgage and the 17.9% with at least 50% equity (25.7% of the 69.3% of homes with a mortgage), we realize that 48.2% of all homes in the country have at least 50% equity.

Bottom Line

Unlike 2008, almost half of the homeowners in the country are sitting on massive amounts of home equity. They will not be walking away from their homes if the housing market begins to soften.

November real estate roundup!

We hit the town to show you the coolest places in Salt Lake in our Feature Fridays. Here’s one of our favorites from last month.

The Train Shoppe is a hobby shop with a hidden treasure in the back, a bustling old city called Salty Gulch. It’s a real treat for kids and adults alike. With train rides, a carousel, and games, make your next party one to remember at the Train Shoppe!


Real estate stats

See what’s happening in real estate.


Market tip: How to sell in the fall

Selling your house? Use the season to make it extra enticing, e.g., do a fall cleanup and add curbside decor.


24% of Renters Believe Winter is the Best Time to Buy a Home

24% of Renters Believe Winter is the Best Time to Buy a Home | Simplifying The Market

In real estate, the spring is often seen as the ideal time to buy or sell a house. The term “Spring Buyer’s Season” exists for a reason, as renters and those looking to move on from their current home thaw out from the winter and hit the market ready to buy.

According to Bank of America’s annual Home Buyer Insights Report, 41% of renters surveyed agree that spring is the best time to buy a home. The surprising result, however, is that when ranking the seasons, winter comes in second at 24%.

24% of Renters Believe Winter is the Best Time to Buy a Home | Simplifying The Market

In many areas of the country, the spring and summer are the most competitive seasons for buyers. Families with children often want to move over the summer to make sure that their kids are ready for school in the fall. This often leads those families who haven’t found homes to buy to push pause on their search in the fall and winter months.

This creates a great environment for buyers to find a home with less competition. According to moving.com, scheduling a move during the winter months also comes with the best price.

If you define ‘best’ by cost then, generally speaking, you are more likely to save on a move during the late September to April window. Demand for movers usually slows down during this time frame and rates are low.

There are also many benefits to listing your house for sale during the winter months as well!

As we recently mentioned, buyers who are out in the winter are serious about wanting to find a home, and there is traditionally less competition on the market which gives you greater exposure to those buyers.

Bottom Line

As always, the best time to buy or move all depends on each individual buyer or seller’s goals and needs. If you are one of the many who would like to make a move this winter, let’s get together to create a plan to make it happen!