Placeholder canvas

Homes Are More Affordable Today, Not Less Affordable

Homes Are More Affordable Today, Not Less Affordable | Simplifying The Market

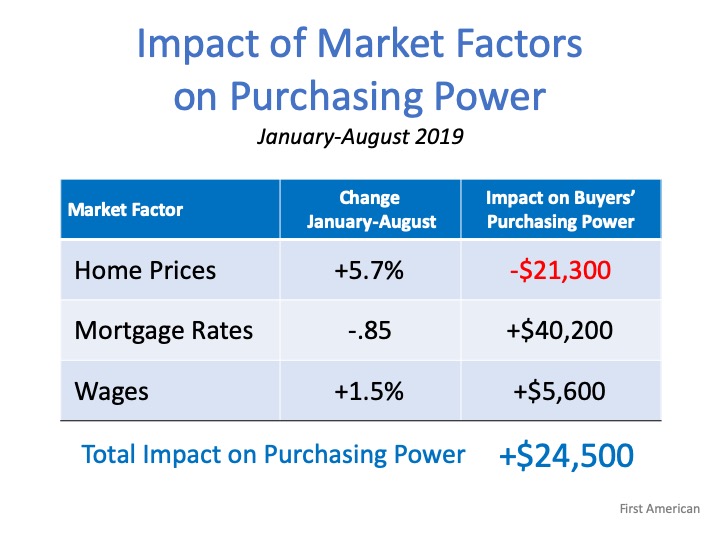
There’s a current narrative that owning a home today is less affordable than it has been in the past. The reason some are making this claim is because house prices have substantially increased over the last several years.

It’s not, however, just the price of a home that matters.

Homes, in most cases, are purchased with a mortgage. The current mortgage rate is a major component of the affordability equation. Mortgage rates have fallen by over a full percentage point since December 2018. Another major piece of the affordability equation is a buyer’s income. The median family income has risen by approximately 3% over the last year.

The National Association of Realtors (NAR) releases a monthly Housing Affordability Index. The latest index shows that home affordability is better today than at almost any point over the last 30 years. The index determines how affordable homes are based on the following:

“A Home Affordability Index value of 100 means that a family with the median income has exactly enough income to qualify for a mortgage on a median-priced home. An index of 120 signifies that a family earning the median income has 20 percent more than the level of income needed pay the mortgage on a median-priced home, assuming a 20 percent down payment so that the monthly payment and interest will not exceed 25 percent of this level of income (qualifying income).”

The higher the index, therefore, the more affordable homes are. Here is a graph showing the index since 1990:Homes Are More Affordable Today, Not Less Affordable | Simplifying The MarketObviously, affordability was better during the housing crash when distressed properties – foreclosures and short sales – sold at major discounts (2009-2015). Outside of that period, however, homes are more affordable today than any other year since 1990, except for 2016.

The report on the index also includes a section that calculates the mortgage payment on a median priced home as a percentage of the median national income. Historically, that percentage is just above 21%. Here are the percentages since June of 2018:Homes Are More Affordable Today, Not Less Affordable | Simplifying The MarketAgain, we can see that affordability is much better today than the historical average and has been getting better over the last year and a half.

Bottom Line

Whether you’re thinking about buying your first home or moving up to the home of your dreams, don’t let the false narrative about affordability prevent you from moving forward. From an affordability standpoint, this is one of the best times to buy in the last 30 years.

Content previously posted on Keeping Current Matters

The 2020 Real Estate Projections That May Surprise You

The 2020 Real Estate Projections That May Surprise You | Simplifying The Market

This will be an interesting year for residential real estate. With a presidential election taking place this fall and talk of a possible recession occurring before the end of the year, predicting what will happen in the 2020 U.S. housing market can be challenging. As a result, taking a look at the combined projections from the most trusted entities in the industry when it comes to mortgage rates, home sales, and home prices is incredibly valuable – and they may surprise you.

Mortgage Rates

Projections from the experts at the National Association of Realtors (NAR), the Mortgage Bankers Association (MBA), Fannie Mae, and Freddie Mac all forecast mortgage rates remaining stable throughout 2020:The 2020 Real Estate Projections That May Surprise You | Simplifying The MarketSince rates have remained under 5% for the last decade, we may not fully realize the opportunity we have right now.

Here are the average mortgage interest rates over the last several decades:

  • 1970s: 8.86%
  • 1980s: 12.70%
  • 1990s: 8.12%
  • 2000s: 6.29%

Home Sales

Three of the four expert groups noted above also predict an increase in home sales in 2020, and the fourth sees the transaction number remaining stable:The 2020 Real Estate Projections That May Surprise You | Simplifying The MarketWith mortgage rates remaining near all-time lows, demand should not be a challenge. The lack of available inventory, however, may moderate the increase in sales.

Home Prices

Below are the projections from six different expert entities that look closely at home values: CoreLogic, Fannie Mae, Ivy Zelman’s “Z Report”, the National Association of Realtors (NAR), Freddie Mac, and the Mortgage Bankers Association (MBA).The 2020 Real Estate Projections That May Surprise You | Simplifying The MarketEach group has home values continuing to improve through 2020, with four of them seeing price appreciation increasing at a greater pace than it did in 2019.

Is a Recession Possible?

In early 2019, a large percentage of economists began predicting a recession may occur in 2020. In addition, a recent survey of potential home purchasers showed that over 50% agreed it would occur this year. The economy, however, remained strong in the fourth quarter, and that has caused many to rethink the possibility.

For example, Goldman Sachs, in their 2020 U.S. Outlook, explained:

“Markets sounded the recession alarm this year, and the average forecaster now sees a 33% chance of recession over the next year. In contrast, our new recession model suggests just a 20% probability. Despite the record age of the expansion, the usual late-cycle problems—inflationary overheating and financial imbalances—do not look threatening.”

Bottom Line

Mortgage rates are projected to remain under 4%, causing sales to increase in 2020. With growing demand and a limited supply of inventory, prices will continue to appreciate, while the threat of an impending recession seems to be softening. It looks like 2020 may be a solid year for the real estate market.

Content previously posted on Keeping Current Matters

2020 Forecast Shows Continued Home Price Appreciation

2020 Forecast Shows Continued Home Price Appreciation | Simplifying The Market

Questions continue to rise around where home prices will head in 2020. The latest forecast from CoreLogic shows continued appreciation at 5.4% over the next year:
2020 Forecast Shows Continued Home Price Appreciation | Simplifying The Market
Additionally, ARCH Mortgage Insurance Company in their current Housing and Mortgage Market Review revealed their latest ARCH Risk Index, which estimates the probability of home prices being lower in two years. Based on the most recent results, 32 of the 50 U.S. states (plus D.C.) had a minimal probability of lowering by 2021.2020 Forecast Shows Continued Home Price Appreciation | Simplifying The Market

Bottom Line

Experts forecast home price appreciation to continue at a moderate rate as we move through 2020 and beyond. With appreciation growing, let’s get together and plan for your next move.

Content previously posted on Keeping Current Matters

Have You Budgeted for Closing Costs?

Have You Budgeted for Closing Costs? | Simplifying The Market

Saving for a down payment is a key step in the homebuying process, and it’s not the only piece you need to include in your budget. Another factor that’s important to plan for is the closing costs required to obtain a mortgage.

What Are Closing Costs?

According to Trulia,

When you close on a home, a number of fees are due. They typically range from 2% to 5% of the total cost of the home, and can include title insurance, origination fees, underwriting fees, document preparation fees, and more.”

For those who buy a $250,000 home, for example, that amount could be between $5,000 and $12,500 in closing fees. Keep in mind, if you’re in the market for a home above this price range, your costs could be significantly greater. As mentioned before,

Closing costs are typically between 2% and 5% of your purchase price.

 Trulia gives more great advice, saying,

“There will be lots of paperwork in front of you on closing day, and not enough time to read them all. Work closely with your real estate agent, lender, and attorney, if you have one, to get all the documents you need ahead of time.

The most important thing to read is the closing disclosure, which shows your loan terms, final closing costs, and any outstanding fees. You’ll get this form about three days before closing since, once you (the borrower) sign it, there’s a three-day waiting period before you can sign the mortgage loan docs. If you have any questions about the numbers or what any of the mortgage terms mean, this is the time to ask—your real estate agent is a great resource for getting you all the answers you need.”

Bottom Line

Let’s get together to discuss the homebuying process, to be sure your plan includes budgeting for what you need to purchase your dream home – without any surprises!

Content previously posted on Keeping Current Matters

The Cost of Renting vs. Buying a Home [INFOGRAPHIC]

The Cost of Renting vs. Buying a Home [INFOGRAPHIC] | Simplifying The Market

The Cost of Renting vs. Buying a Home [INFOGRAPHIC] | Simplifying The Market

Some Highlights:

  • Historically, the choice between renting and buying a home has been a tough decision.
  • Looking at the percentage of income needed to rent a median-priced home today (27.7%) vs. the percentage needed to buy a median-priced home (17.5%), the choice is clear.
  • Every market is different. Before you renew your lease, find out if you can put your housing costs to work by buying a home this year.

Forget the Price of the Home. The Cost is What Matters.

Forget the Price of the Home. The Cost is What Matters. | Simplifying The Market

Home buying activity (demand) is up, and the number of available listings (supply) is down. When demand outpaces supply, prices appreciate. That’s why firms are beginning to increase their projections for home price appreciation going forward. As an example, CoreLogic increased their 12-month projection for home values from 4.5% to 5.6% over the last few months.

The reacceleration of home values will cause some to again voice concerns about affordability. Just last week, however, First American came out with a data analysis that explains how price is not the only market factor that impacts affordability. They studied prices, mortgage rates, and wages from January through August of this year. Here are their findings:

Home Prices

“In January 2019, a family with the median household income in the U.S. could afford to buy a $373,900 house. By August, that home had appreciated to $395,000, an increase of $21,100.”

Mortgage Interest Rates

“The 0.85 percentage point drop in mortgage rates from January 2019 through August 2019 increased affordability by 9.7%. That translates to a $40,200 improvement in house-buying power in just eight months.”

Wage Growth

“As rates have fallen in 2019, the economy has continued to perform well also, resulting in a tight labor market and wage growth. Wage growth pushes household incomes upward, which were 1.5% higher in August compared with January. The growth in household income increased consumer house-buying power by 1.5%, pushing house-buying power up an additional $5,600.”

When all three market factors are combined, purchasing power increased by $24,500, thus making home buying more affordable, not less affordable. Here is a table that simply shows the data:Forget the Price of the Home. The Cost is What Matters. | Simplifying The Market

Bottom Line

In the article, Mark Fleming, Chief Economist at First American, explained it best:

“Focusing on nominal house price changes alone as an indication of changing affordability, or even the relationship between nominal house price growth and income growth, overlooks what matters more to potential buyers – surging house-buying power driven by the dynamic duo of mortgage rates and income growth. And, we all know from experience, you buy what you can afford to pay per month.”

How to Determine If You Can Afford to Buy a Home

The gap between the increase in personal income and residential real estate prices has been used to defend the concept that we are experiencing an affordability crisis in housing today.

It is true that home prices and wages are two key elements in any affordability equation. There is, however, an extremely important third component to that equation: mortgage interest rates.

Mortgage interest rates have fallen by more than a full percentage point from this time last year. Today’s rate is 3.75%; it was 4.86% at this time last year. This has dramatically increased a purchaser’s ability to afford a home.

Here are three reports validating that purchasing a home is in fact more affordable today than it was a year ago:

CoreLogic’s Typical Mortgage Payment

“Falling mortgage rates and slower home-price growth mean that many buyers this year are committing to lower mortgage payments than they would have faced for the same home last year. After rising at a double-digit annual pace in 2018, the principal-and-interest payment on the nation’s median-priced home – what we call the “typical mortgage payment”– fell year-over-year again.”  

The National Association of Realtors’ Affordability Index

“At the national level, housing affordability is up from last month and up from a year ago…All four regions saw an increase in affordability from a year ago…Payment as a percentage of income was down from a year ago.”

First American’s Real House Price Index (RHPI)

“In 2019, the dynamic duo of lower mortgage rates and rising incomes overcame the negative impact of rising house price appreciation on affordability. Indeed, affordability reached its highest point since January 2018. Focusing on nominal house price changes alone as an indication of changing affordability, or even the relationship between nominal house price growth and income growth, overlooks what matters more to potential buyers – surging house-buying power driven by the dynamic duo of mortgage rates and income growth. And, we all know from experience, you buy what you can afford to pay per month.”

Bottom Line

Though the price of homes may still be rising, the cost of purchasing a home is actually falling. If you’re thinking of buying your first home or moving up to your dream home, let’s connect so you can better understand the difference between the two.

Think Prices Have Skyrocketed? Look at Rents.

Think Prices Have Skyrocketed? Look at Rents. | Simplifying The Market

Much has been written about how residential real estate values have increased since the housing market started its recovery in 2012. However, little has been shared about what has taken place with residential rental prices. Let’s shed a little light on this subject.

In the most recent Apartment Rent Report, RentCafe explains how rents have continued to increase over the last twelve months because of a large demand and a limited supply.

 “Continued interest in rental apartments and slowing construction keeps the national average rent on a strong upward trend.”

Zillow, in its latest Rent Index, agreed that rents are continuing on an “upward trend” across most of the country, and that the trend is accelerating:

“The median U.S. rent grew 2% year-over-year, to $1,595 per month. National rent growth is faster than a year ago, and while 46 of the 50 largest markets are showing deceleration in annual home value growth, annual rent growth is accelerating in 41 of the largest 50 markets.”

The Zillow report went on to detail rent increases since the beginning of the housing market recovery in 2012. Here is a graph showing the increases:Think Prices Have Skyrocketed? Look at Rents. | Simplifying The Market

Bottom Line

It is true that home prices have risen over the past seven years, increasing the cost of owning a home. However, the cost of renting a home has also increased over that same time period.

Depending on the Price, You’re Going to Need Advice

Depending on the Price, You’re Going to Need Advice | Simplifying The Market

To understand today’s complex real estate market, it is critical to have a local, trusted advisor on your side – for more reasons than you may think.

In real estate today, there are essentially three different price points in the market: the starter-home market, the middle-home market, and the premium or luxury market. Each one is unique, and depending on the city, the price point in these categories will vary. For example, a starter or lower-end home in San Francisco, California is much more expensive than almost any other part of the country. Let’s explore what you need to know about each of these tiers.

Starter-Home Market: This market varies by price, and these homes are typically purchased by first-time home buyers or investors looking to flip them for a profit. Across the country, homes in this space currently have less than 6 months of inventory for sale. That means there aren’t enough homes on the lower end of the market for the number of people who want to buy them. A low supply like this generally increases competition, drives bidding wars, and sets up an environment where homes sell above the listing price. According to data from the National Association of Realtors (NAR) on realtor.com,

“The desire for affordability continues to push down the inventory for homes listed for less than $200,000.00.”

Middle-Home Market: This segment is often thought of as the move-up market. Typically, the buyer in this market is moving up to a larger, more custom home with more features, all coming at a higher price. Across the country, this market is looking more balanced than the lower end of the market, meaning it has closer to a 6-month supply of inventory for sale. This market is more neutral, but leaning towards a seller’s market.

Premium & Luxury Home Market: This is the top end of the market with larger homes that have even more custom features and upgrades. Nationwide, this market is growing in the number of homes for sale. In the same realtor.com article, we can see that year-over-year inventory of homes in this tier has grown by 4.7%. Today, there are more homes available in the premium and luxury space, leading to more of a buyer’s market at this end.

Bottom Line

Depending on the segment of the market and the price point you’re looking at, you’re going to need the advice of a true local market expert. Let’s get together to help you navigate the home-buying or selling process in your market.