Placeholder canvas

How to Simply Increase Your Family Wealth by Paying for Housing

How to Simply Increase Your Family Wealth by Paying for Housing | Simplifying the Market

Everyone should realize that unless you are living somewhere rent-free, you are paying a mortgage – either yours or your landlord’s. Buying your own home provides you with a form of ‘forced savings’ that allows you to use your monthly housing costs to increase your family’s wealth.

Every month that you pay your mortgage, you are paying off a portion of the debt that you took on to purchase your home. Therefore, you own a little bit more of your home every month in the form of home equity. As your home’s value increases you also gain home equity.

Every quarter, Pulsenomics surveys a nationwide panel of over 100 economists, real estate experts, and investment and market strategists and asks them to project how residential home prices will appreciate over the next five years for their Home Price Expectation Survey (HPES).

The latest data from their Q4 2018 Survey revealed that home prices are expected to round out the year 5.8% higher than they were in January. For the next 5 years, home values will appreciate by an average of nearly 3% a year.

This is still great news for homeowners!

For example, let’s assume a young couple purchases and closes on a $250,000 home in January. Simply through their home appreciating in value, those homeowners can build their home equity by nearly $40,000 over the next five years.

How to Simply Increase Your Family Wealth by Paying for Housing | Simplifying the Market

Let’s look at the potential equity gained over the same period of time at some higher price points:

How to Simply Increase Your Family Wealth by Paying for Housing | Simplifying the Market

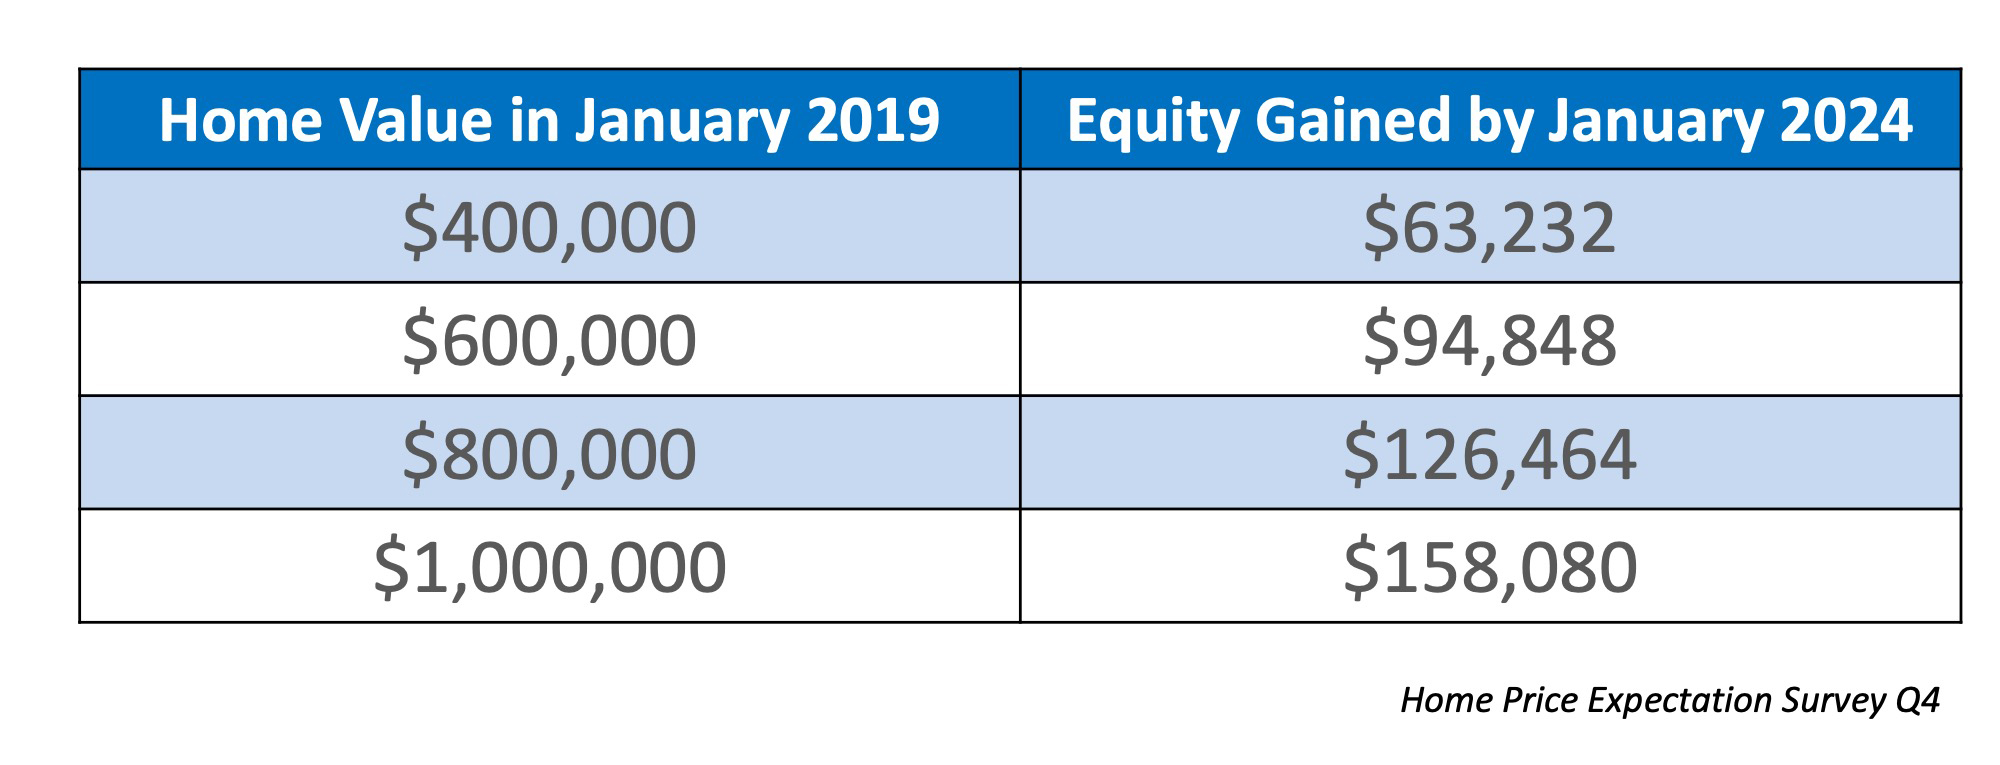
In many cases, home equity is a large portion of a family’s overall net worth.

Bottom Line

If your plan for 2019 includes entering the housing market to purchase a home, whether it’s your first or your fifth, let’s get together to make your plan a reality!

The Tale of Two Markets [INFOGRAPHIC]

The Tale of Two Markets [INFOGRAPHIC] | Simplifying The Market

The Tale of Two Markets [INFOGRAPHIC] | Simplifying The Market

Some Highlights:

  • An emerging trend for some time now has been the difference between available inventory and demand in the premium and luxury markets and that in the starter and trade-up markets and what those differences are doing to prices!
  • Inventory continues to rise in the luxury and premium home markets which is causing prices to cool.
  • Demand continues to rise with lower-than-normal inventory levels in the starter and trade-up home markets, causing prices to rise on a year-over-year basis for 80 consecutive months.

2008 vs. Now: Are Owners Using Their Homes as ATMs Again?

2008 vs. Now: Are Owners Using Their Homes as ATMs Again? | Simplifying The Market

Over the last six years, we have experienced strong price appreciation which has increased home equity levels dramatically. As the number of “cash-out” refinances begins to approach numbers last seen during the crash, some are afraid that we may be repeating last decade’s mistake.

However, a closer look at the numbers shows that homeowners are being much more responsible with their home equity this time around.

What happened then…

When real estate values began to surge last decade, people started using their homes as personal ATMs. Homeowners would refinance their houses and convert their equity into instant cash (known as “cash-out” refinances). Because homes were appreciating so rapidly, many homeowners tapped into their equity multiple times.

This left homeowners with little-or-no equity left in their homes, so when prices started to fall many homeowners found their houses in a negative equity situation (where the mortgage amount was greater than the value of the home). When some of these homeowners saw that there was no value left in their houses, they just stopped paying their mortgages altogether.

Banks eventually foreclosed on those homes and the foreclosures drove prices down even further and put more homes in the negative equity category. This cycle continued, leading to the worst housing crash in almost one hundred years.

What’s happening now…

Again, Americans are seeing their home equity grow. Today, over 48% of all single-family homes in the country have over 50% equity, and yes, some families are tapping into that equity. However, this time around, homeowners are not doing making irresponsible decisions. According to the latest information from Freddie Mac, the total equity being “cashed out” is a fraction of what it was leading up to the crash. Here are the numbers:

2008 vs. Now: Are Owners Using Their Homes as ATMs Again? | Simplifying The Market

Bottom Line

The recklessness that accompanied the build-up in equity prior to the last crash does not exist today. That makes this housing market much more secure than the one we had heading into 2008.

Home Prices Up 6.34% Across the Country! [INFOGRAPHIC]

Home Prices Up 6.34% Across the Country! [INFOGRAPHIC] | Simplifying The Market

Some Highlights:

  • The Federal Housing Finance Agency (FHFA) recently released their latest Quarterly Home Price Index report.
  • In the report, home prices are compared both regionally and by state.
  • Based on the latest numbers, if you plan on relocating to another state, waiting to move may end up costing you more!

Further Proof It’s NOT 2008 All Over Again

Further Proof It’s NOT 2008 All Over Again | Simplifying The Market

Home sales numbers are leveling off, the rate of price appreciation has slowed to more historically normal averages, and inventory is finally increasing. We are headed into a more normal housing market.

However, some are seeing these adjustments as red flags and are suggesting that we are headed back to the same challenges we experienced in 2008. Today, let’s look at one set of statistics that prove the current market is nothing like the one that preceded the housing crash last decade.

The previous bubble was partially caused by unhealthy levels of mortgage debt. New purchasers were putting down the minimum down payment, resulting in them having little if any equity in their homes.

Existing homeowners were using their homes as ATMs by refinancing and swapping their equity for cash. When prices started to fall, many homeowners found themselves in a negative equity situation (where their mortgage was higher than the value of their home) so they walked away which caused prices to fall even further. When this happened, even more homeowners found themselves in negative equity situations which caused them to walk away as well, and so a vicious cycle formed.

Today, the equity situation is totally different. According to a new report from ATTOM Data Solutions more than 1-in-4 homes with a mortgage have at least 50% equity. The report explains:

“…nearly 14.5 million U.S. properties were equity rich — where the combined estimated amount of loans secured by the property was 50 percent or less of the property’s estimated market value…The 14.5 million equity rich properties in Q3 2018 represented 25.7 percent of all properties with a mortgage.”

In addition, according to the U.S. Census Bureau, 30.3% of homes in the country have no mortgage on them.

Further Proof It’s NOT 2008 All Over Again | Simplifying The Market

Almost 50% of all homes have at least 50% equity.

If we take both numbers, the 30.3% of all homes without a mortgage and the 17.9% with at least 50% equity (25.7% of the 69.3% of homes with a mortgage), we realize that 48.2% of all homes in the country have at least 50% equity.

Bottom Line

Unlike 2008, almost half of the homeowners in the country are sitting on massive amounts of home equity. They will not be walking away from their homes if the housing market begins to soften.

24% of Renters Believe Winter is the Best Time to Buy a Home

24% of Renters Believe Winter is the Best Time to Buy a Home | Simplifying The Market

In real estate, the spring is often seen as the ideal time to buy or sell a house. The term “Spring Buyer’s Season” exists for a reason, as renters and those looking to move on from their current home thaw out from the winter and hit the market ready to buy.

According to Bank of America’s annual Home Buyer Insights Report, 41% of renters surveyed agree that spring is the best time to buy a home. The surprising result, however, is that when ranking the seasons, winter comes in second at 24%.

24% of Renters Believe Winter is the Best Time to Buy a Home | Simplifying The Market

In many areas of the country, the spring and summer are the most competitive seasons for buyers. Families with children often want to move over the summer to make sure that their kids are ready for school in the fall. This often leads those families who haven’t found homes to buy to push pause on their search in the fall and winter months.

This creates a great environment for buyers to find a home with less competition. According to moving.com, scheduling a move during the winter months also comes with the best price.

If you define ‘best’ by cost then, generally speaking, you are more likely to save on a move during the late September to April window. Demand for movers usually slows down during this time frame and rates are low.

There are also many benefits to listing your house for sale during the winter months as well!

As we recently mentioned, buyers who are out in the winter are serious about wanting to find a home, and there is traditionally less competition on the market which gives you greater exposure to those buyers.

Bottom Line

As always, the best time to buy or move all depends on each individual buyer or seller’s goals and needs. If you are one of the many who would like to make a move this winter, let’s get together to create a plan to make it happen!

The #1 Reason to Not Wait Until Spring to Sell Your House

The #1 Reason to Not Wait Until Spring to Sell Your House | Simplifying The Market

Many sellers believe that spring is the best time to place their homes on the market because buyer demand traditionally increases at that time of year, but what they don’t realize is that if every homeowner believes the same thing, then that is when they will have the most competition!

The #1 Reason to List Your Home in the Winter Months is Less Competition!

Housing supply traditionally shrinks at this time of year, so the choices buyers have will be limited. The chart below was created using the months’ supply of listings from the National Association of Realtors.

The #1 Reason to Not Wait Until Spring to Sell Your House | Simplifying The Market

As you can see, the ‘sweet spot’ to list your home for the most exposure naturally occurs in the late fall and winter months (November – February). 

Temperatures aren’t the only thing that heats up in the spring – so do listings!

The #1 Reason to Not Wait Until Spring to Sell Your House | Simplifying The Market

In 2017, listings increased by nearly half a million houses from December to June. Don’t wait for these listings to come to market before you decide to list your house.

Added Bonus: Only Serious Buyers Are Out in the Winter

At this time of year, only those purchasers who are serious about buying a home will be in the marketplace. You and your family will not be bothered and inconvenienced by mere ‘lookers.’ The lookers are at the mall or online doing their holiday shopping.

Bottom Line

If you have been debating whether or not to sell your home and are curious about market conditions in your area, let’s get together to help you decide the best time to list your house for sale.

Existing Home Sales Slowed by a Lack of Listings [INFOGRAPHIC]

Existing Home Sales Slowed by a Lack of Listings [INFOGRAPHIC] | Simplifying The Market

Existing Home Sales Reverse Trend as Buyers Return [INFOGRAPHIC] | Simplifying The Market

Some Highlights:

  • Existing home sales are currently at an annual pace of 5.22 million, which is up 1.4% over last month. This reverses the six-month trend of dips in sales every month.
  • The inventory of existing homes is still below the 6-month supply needed for a normal market and is now at a 4.3-month supply.
  • NAR’s Chief Economist, Lawrence Yun, had this to say: “After six consecutive months of decline, buyers are finally stepping back into the housing market. As more inventory enters the market and we head into the winter season, home price growth has begun to slow more meaningfully. This allows for much more manageable, less frenzied buying conditions.”

7 Reasons to List Your House For Sale This Holiday Season

7 Reasons to List Your House for Sale This Holiday Season | Simplifying The Market

Every year at this time there are many homeowners who decide to wait until after the holidays to list their homes for the first time, while others who already have their homes on the market decide to take them off until after the holidays.

Here are seven great reasons not to wait:

  1. Relocation buyers are out there. Many companies are still hiring throughout the holidays and need their new employees in their new positions as soon as possible.
  2. Purchasers who are looking for homes during the holidays are serious buyers and are ready to buy now.
  3. You can restrict the showings on your home to the times you want it shown. You will remain in control.
  4. Homes show better when decorated for the holidays.
  5. There is minimal competition for you as a seller right now. Inventory of homes for sale traditionally slows in the late fall, early winter. Let’s take a look at listing inventory as compared to the same time last year:

7 Reasons to List Your House for Sale This Holiday Season | Simplifying The Market

  1. The desire to own a home doesn’t stop when the holidays come. Buyers who were unable to find their dream homes during the busy spring and summer months are still searching!
  2. The supply of listings increases substantially after the holidays. Also, in many parts of the country, new construction will continue to surge and reach new heights which will lessen the demand for your house in 2019.

Bottom Line 

Waiting until after the holidays to sell your home probably doesn’t make sense.

Home Sellers in Q3 Netted $61K at Resale

Home Sellers in Q3 Netted $61K at Resale | Simplifying The Market

According to a recent report by ATTOM Data Solutions, home sellers who sold their homes in the third quarter of 2018 benefited from rising home prices and netted an average of $61,232.

This is the highest average price gain since the second quarter of 2007 and represents a 32% return on the original purchase prices.

After the Great Recession, many homeowners were left in negative equity situations but home price appreciation in the recovery period since then has given homeowners something to smile about.

The results from ATTOM fall right in line with data from the latest edition of the National Association of Realtors’ (NAR) Profile of Home Buyers and Sellers. Below is a chart that was created using NAR’s data to show the percentage of equity that homeowners earned at the time of sale based on when they purchased their homes.

Home Sellers in Q3 Netted $61K at Resale | Simplifying The Market

Even though those who purchased at the peak of the market netted less than those who bought before and after the peak, the good news is that there was a double-digit profit to be had! Many homeowners believe that they are still underwater which has led many of them to not even consider selling their houses.

Bottom Line

If you are curious about how much equity you’d earn if you sold your home, let’s get together to perform an equity review and determine the demand for your home in today’s market!