Placeholder canvas

Existing Home Sales Reach Highest Annual Pace in 11 Years [INFOGRAPHIC]

Existing Home Sales Reach Highest Annual Pace in 11 Years [INFOGRAPHIC] | Simplifying The Market

Some Highlights:

  • Existing home sales are currently at an annual pace of 5.81 million, the highest pace since December 2006.
  • The inventory of existing homes for sale has dropped year-over-year for the last 30 consecutive months and is now at a 3.4-month supply.
  • NAR’s Chief Economist Lawrence Yun had this to say: “Faster economic growth in recent quarters, the booming stock market and continuous job gains are fueling substantial demand for buying a home as 2017 comes to an end.”

Housing Prices are NOT Heading for Another Crash

As home values continue to increase at levels greater than historic norms, some are concerned that we are heading for another crash like the one we experienced ten years ago. We recently explained that the lenient lending standards of the previous decade (which created false demand) no longer exist. But what about prices?

Are prices appreciating at the same rate that they were prior to the crash of 2006-2008? Let’s look at the numbers as reported by Freddie Mac:

Housing Prices are NOT Heading for Another Crash | Simplifying The Market

The levels of appreciation we have experienced over the last four years aren’t anywhere near the levels that were reached in the four years prior to last decade’s crash.

We must also realize that, to a degree, the current run-up in prices is the market trying to catch up after a crash that dramatically dropped prices for five years.

Bottom Line

Prices are appreciating at levels greater than historic norms. However, we are not at the levels that led to the housing bubble and bust.

The Real Reason Home Prices are Increasing

The Real Reason Home Prices are Increasing | Simplifying The Market

There are many unsubstantiated theories as to why home values are continuing to increase. From those who are worried that lending standards are again becoming too lenient (data shows this is untrue), to those who are concerned that prices are again approaching boom peaks because of “irrational exuberance” (this is also untrue as prices are not at peak levels when they are adjusted for inflation), there seems to be no shortage of opinion.

However, the increase in prices is easily explained by the theory of supply & demand. Whenever there is a limited supply of an item that is in high demand, prices increase.

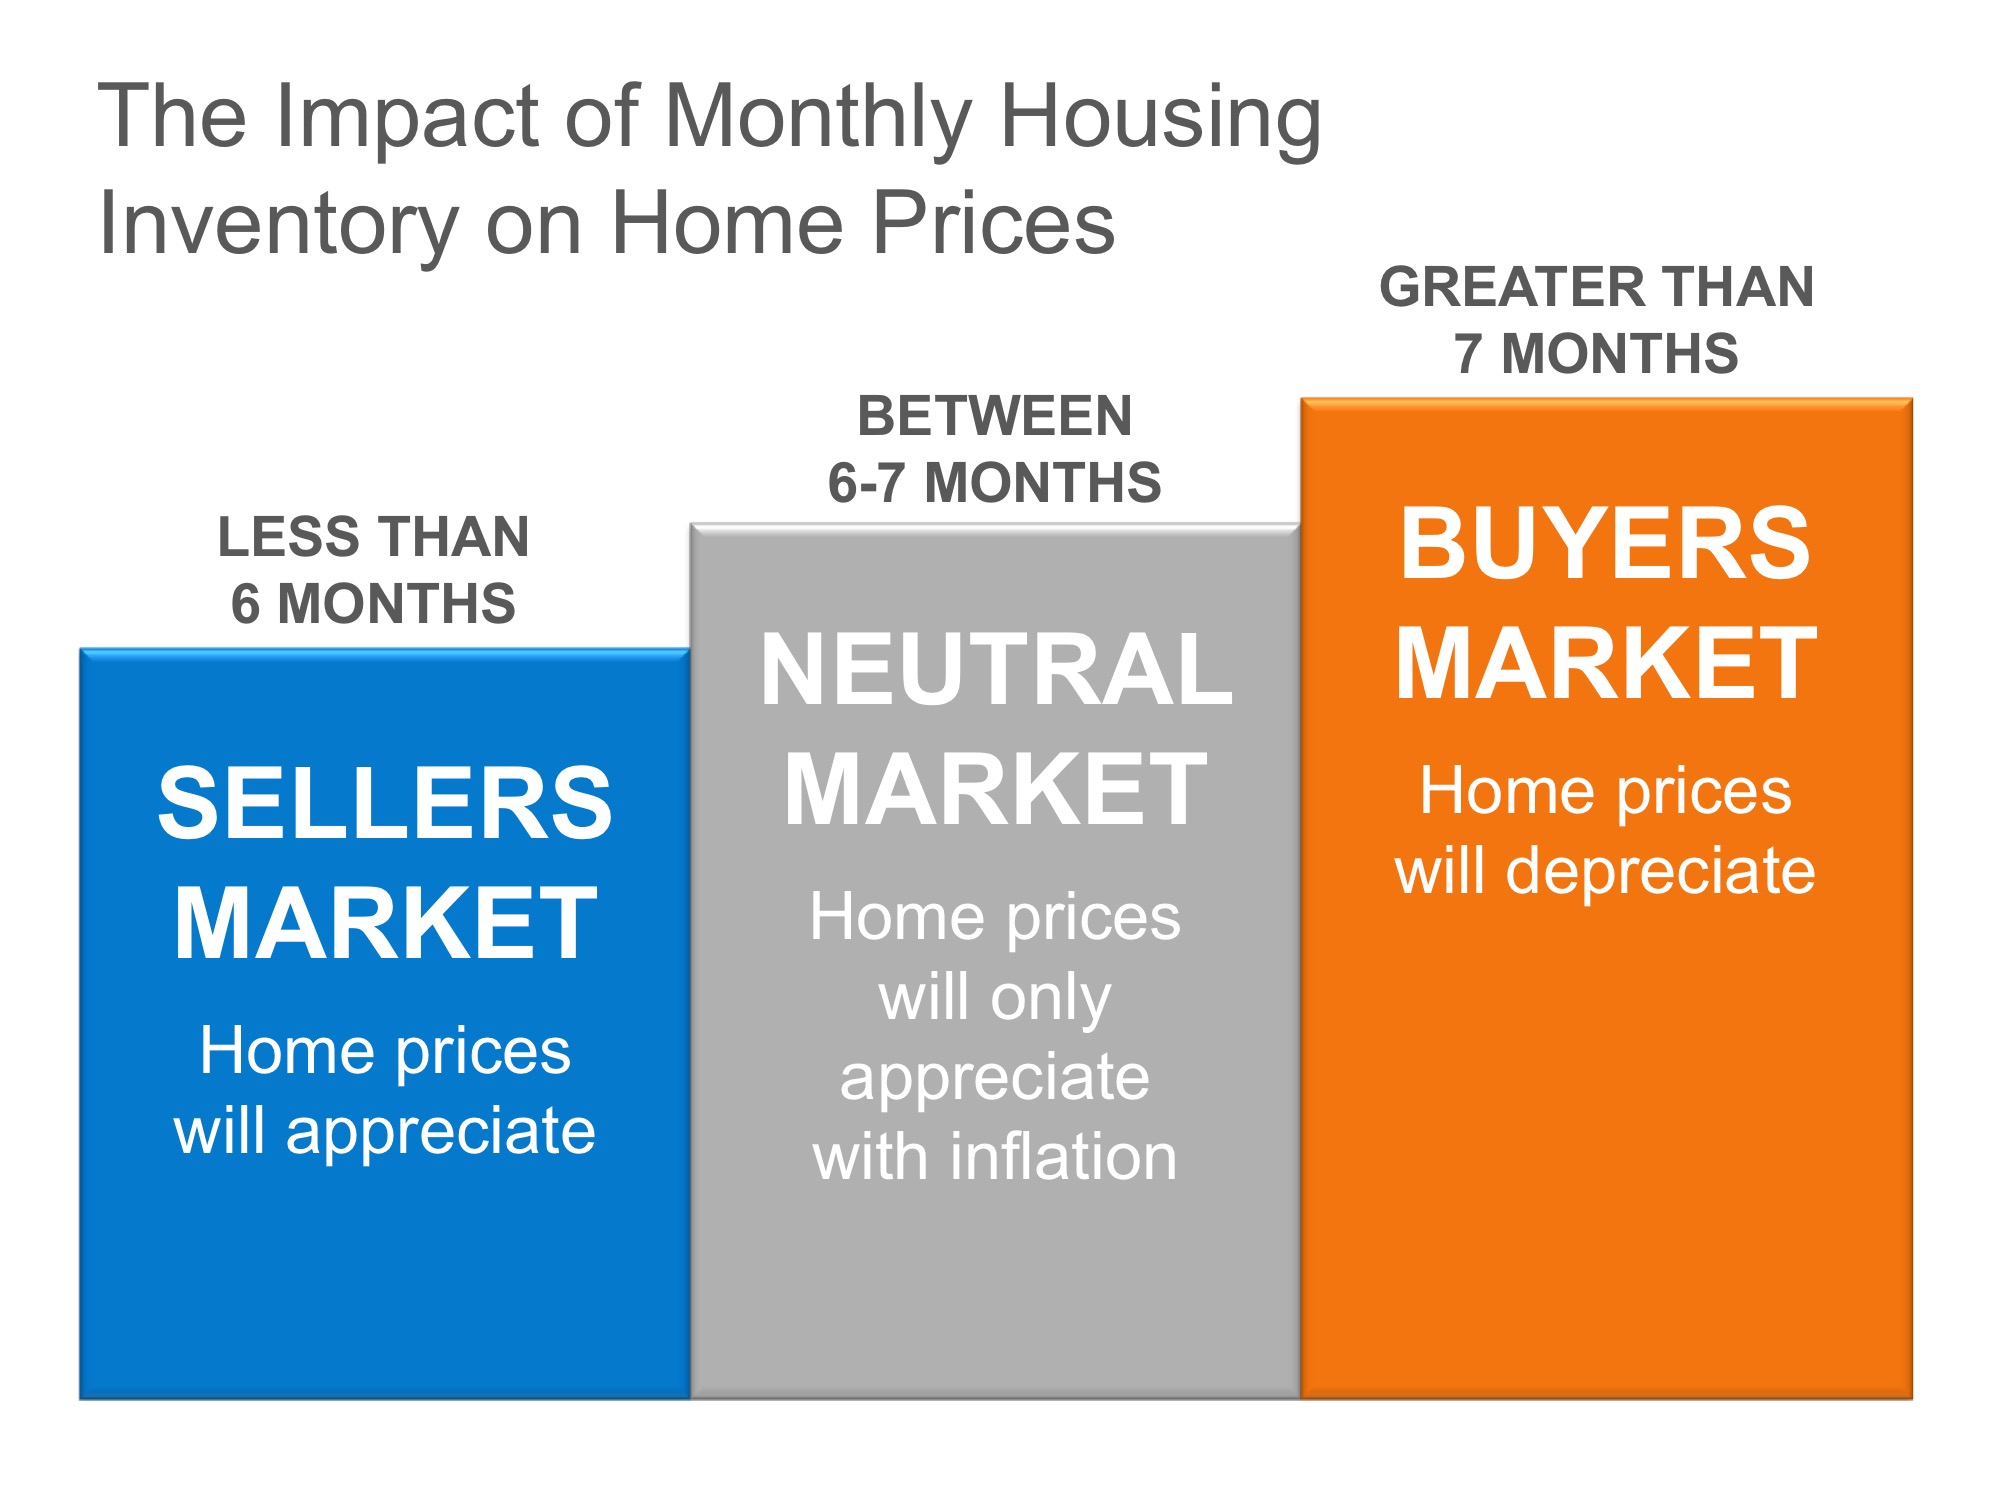
It is that simple. In real estate, it takes a six-month supply of existing salable inventory to maintain pricing stability. In most housing markets, anything less than six months will cause home values to appreciate and anything more than seven months will cause prices to depreciate (see chart 1).

The Real Reason Home Prices are Increasing | Simplifying The Market

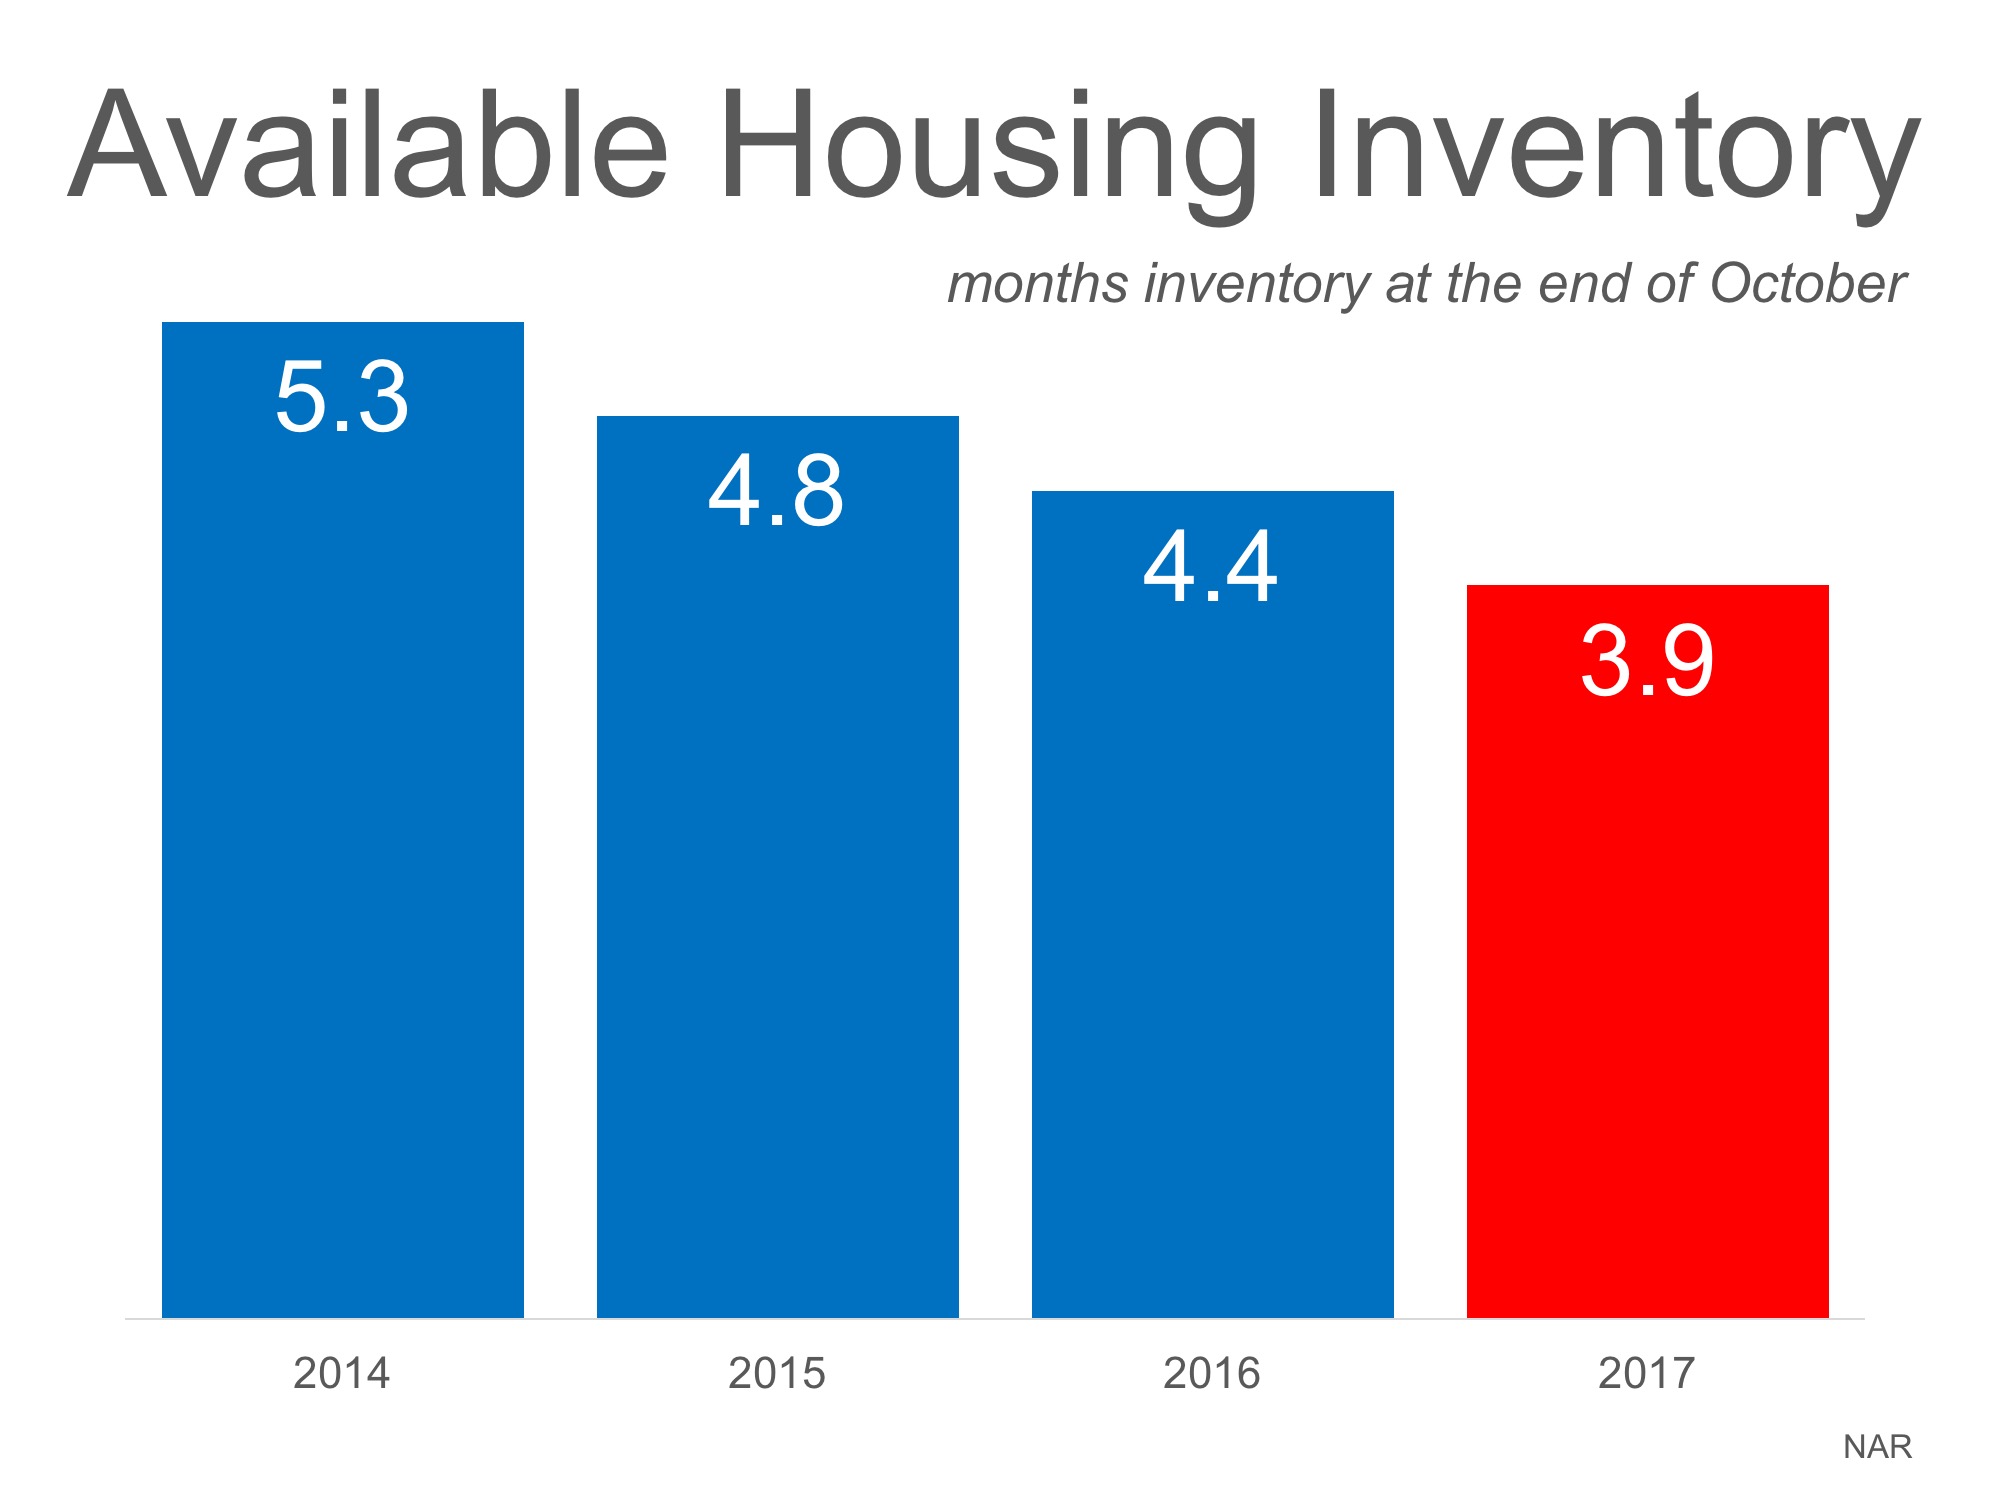
According to the Existing Home Sales Report from the National Association of Realtors (NAR), the monthly inventory of homes has been below six months for the last four years (see chart 2).

The Real Reason Home Prices are Increasing | Simplifying The Market

Bottom Line

If buyer demand outpaces the current supply of existing homes for sale, prices will continue to appreciate. Nothing nefarious is taking place. It is simply the theory of supply & demand working as it should.

Existing Home Sales Slowed by a Lack of Listings [INFOGRAPHIC]

Existing Home Sales Slowed by a Lack of Listings [INFOGRAPHIC] | Simplifying the Market

Some Highlights:

  • The inventory of existing homes for sale has dropped year-over-year for the last 29 consecutive months and is now at a 3.9-month supply.
  • Existing home sales are currently at an annual pace of 5.48 million, the highest pace since June of this year, but down 0.9% from October 2016.
  • NAR’s Chief Economist, Lawrence Yun, had this to say: “While the housing market gained a little more momentum last month, sales are still below year ago levels because low inventory is limiting choices for prospective buyers and keeping price growth elevated.”

Bubble Alert! Is it Getting Too Easy to Get a Mortgage?

Bubble Alert! Is it Getting Too Easy to Get a Mortgage? | Simplifying The Market

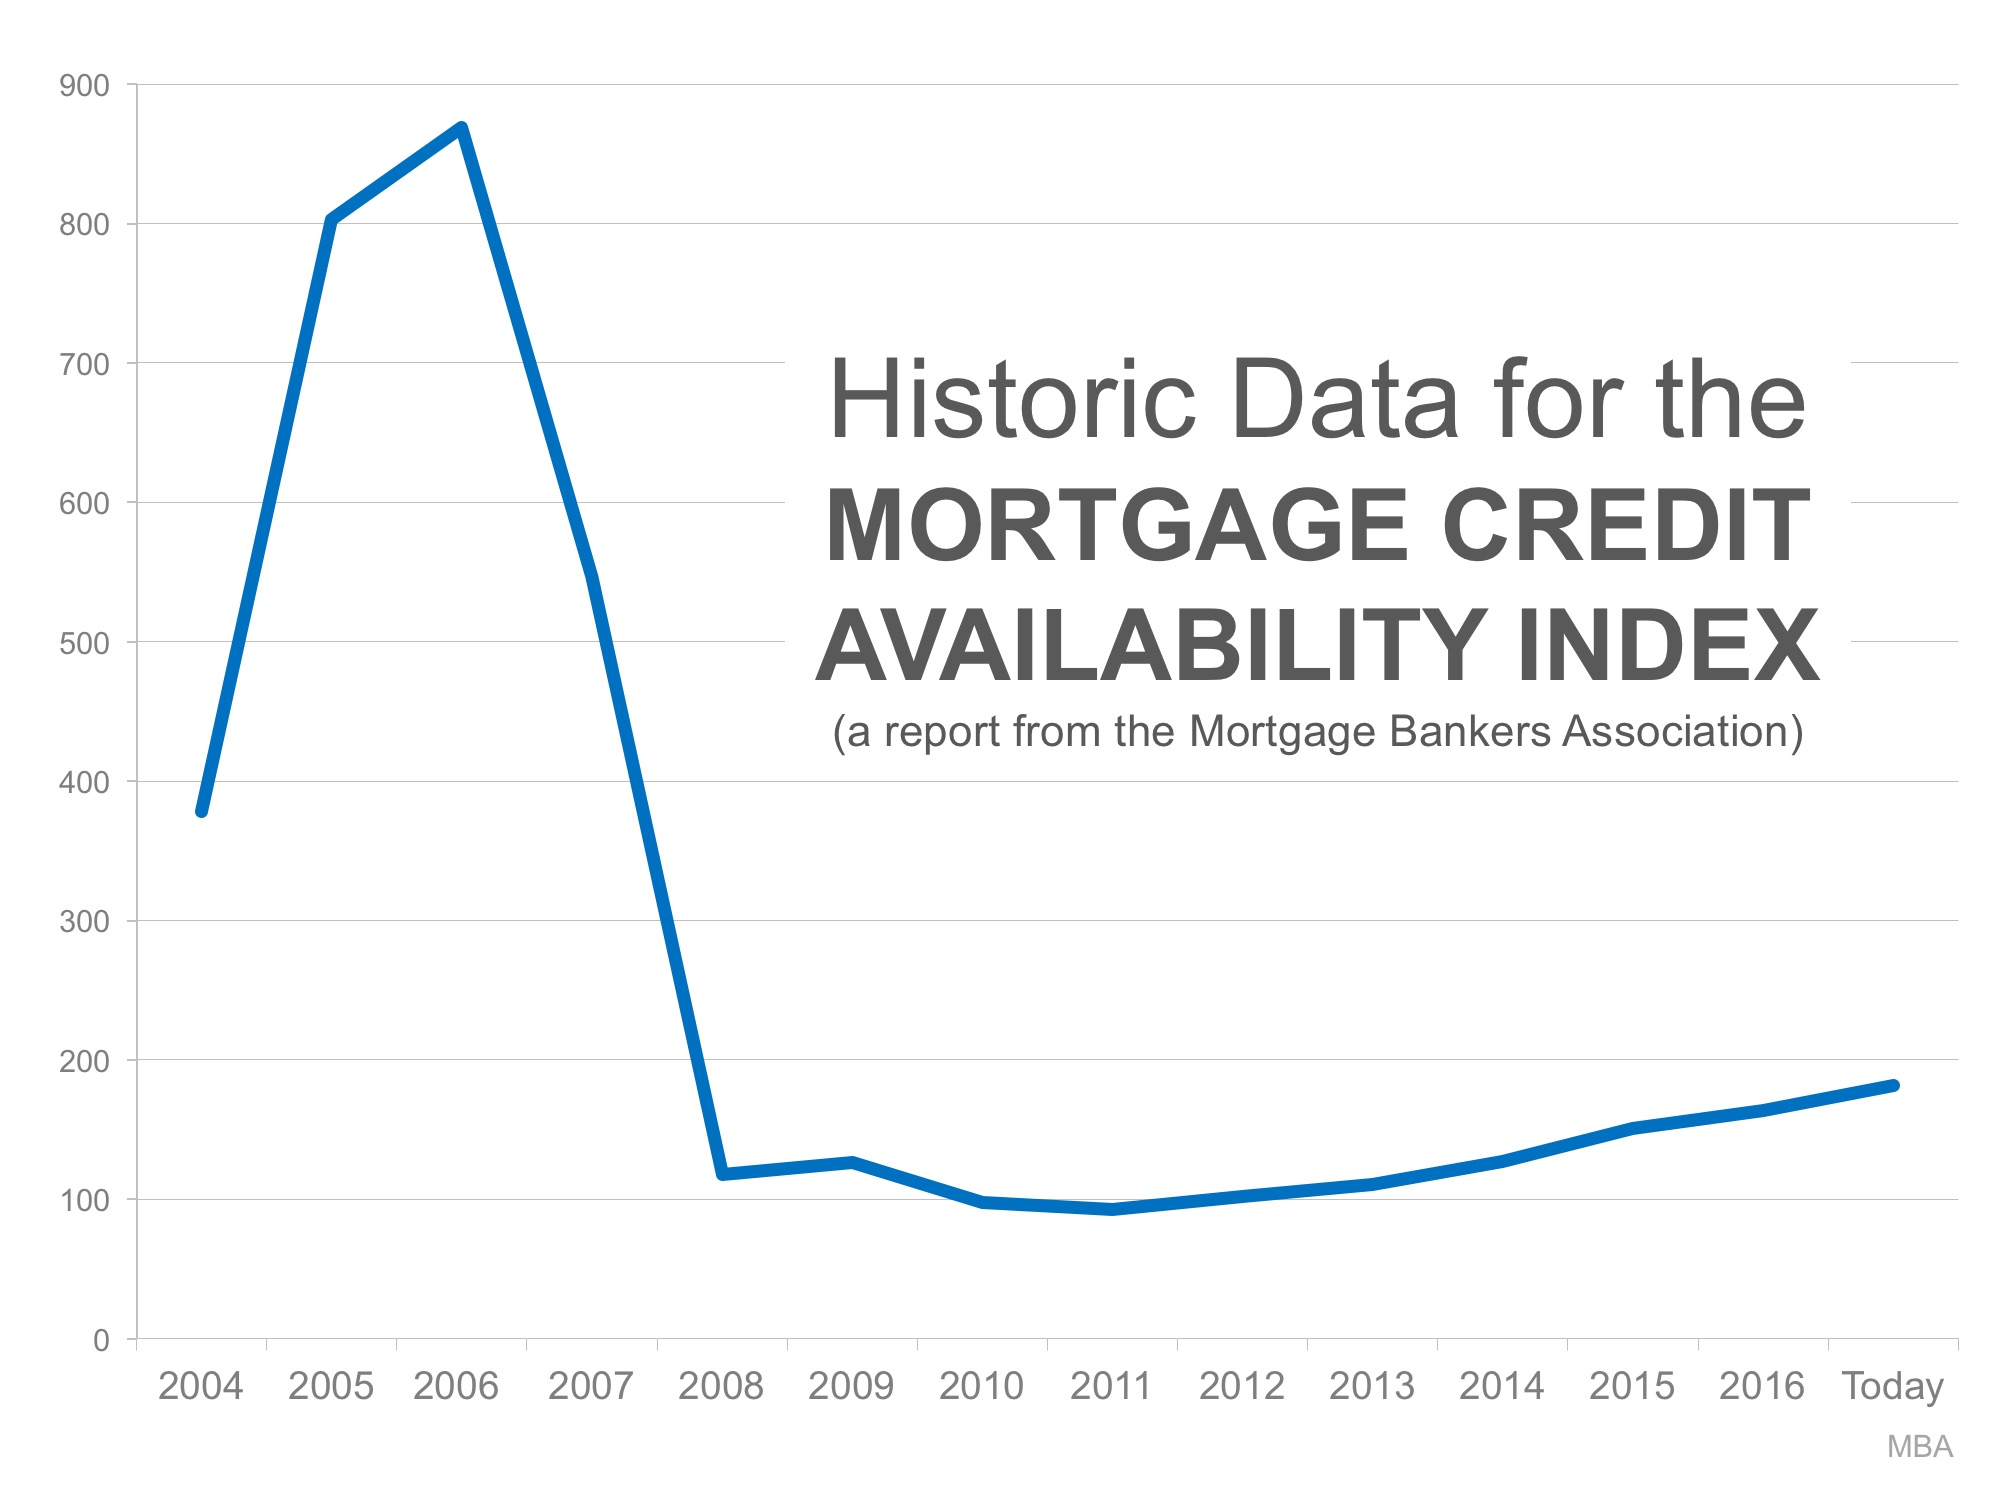
There is little doubt that it is easier to get a home mortgage today than it was last year. The Mortgage Credit Availability Index (MCAI), published by the Mortgage Bankers Association, shows that mortgage credit has become more available in each of the last several years. In fact, in just the last year:

  • More buyers are putting less than 20% down to purchase a home
  • The average credit score on closed mortgages is lower
  • More low-down-payment programs have been introduced

This has some people worrying that we are returning to the lax lending standards which led to the boom and bust that real estate experienced ten years ago. Let’s alleviate some of that concern.

The graph below shows the MCAI going back to the boom years of 2004-2005. The higher the graph line, the easier it was to get a mortgage.

Bubble Alert! Is it Getting Too Easy to Get a Mortgage? | Simplifying The Market


As you can see, lending standards were much more lenient from 2004 to 2007. Though it has gradually become easier to get a mortgage since 2011, we are nowhere near the lenient standards during the boom.

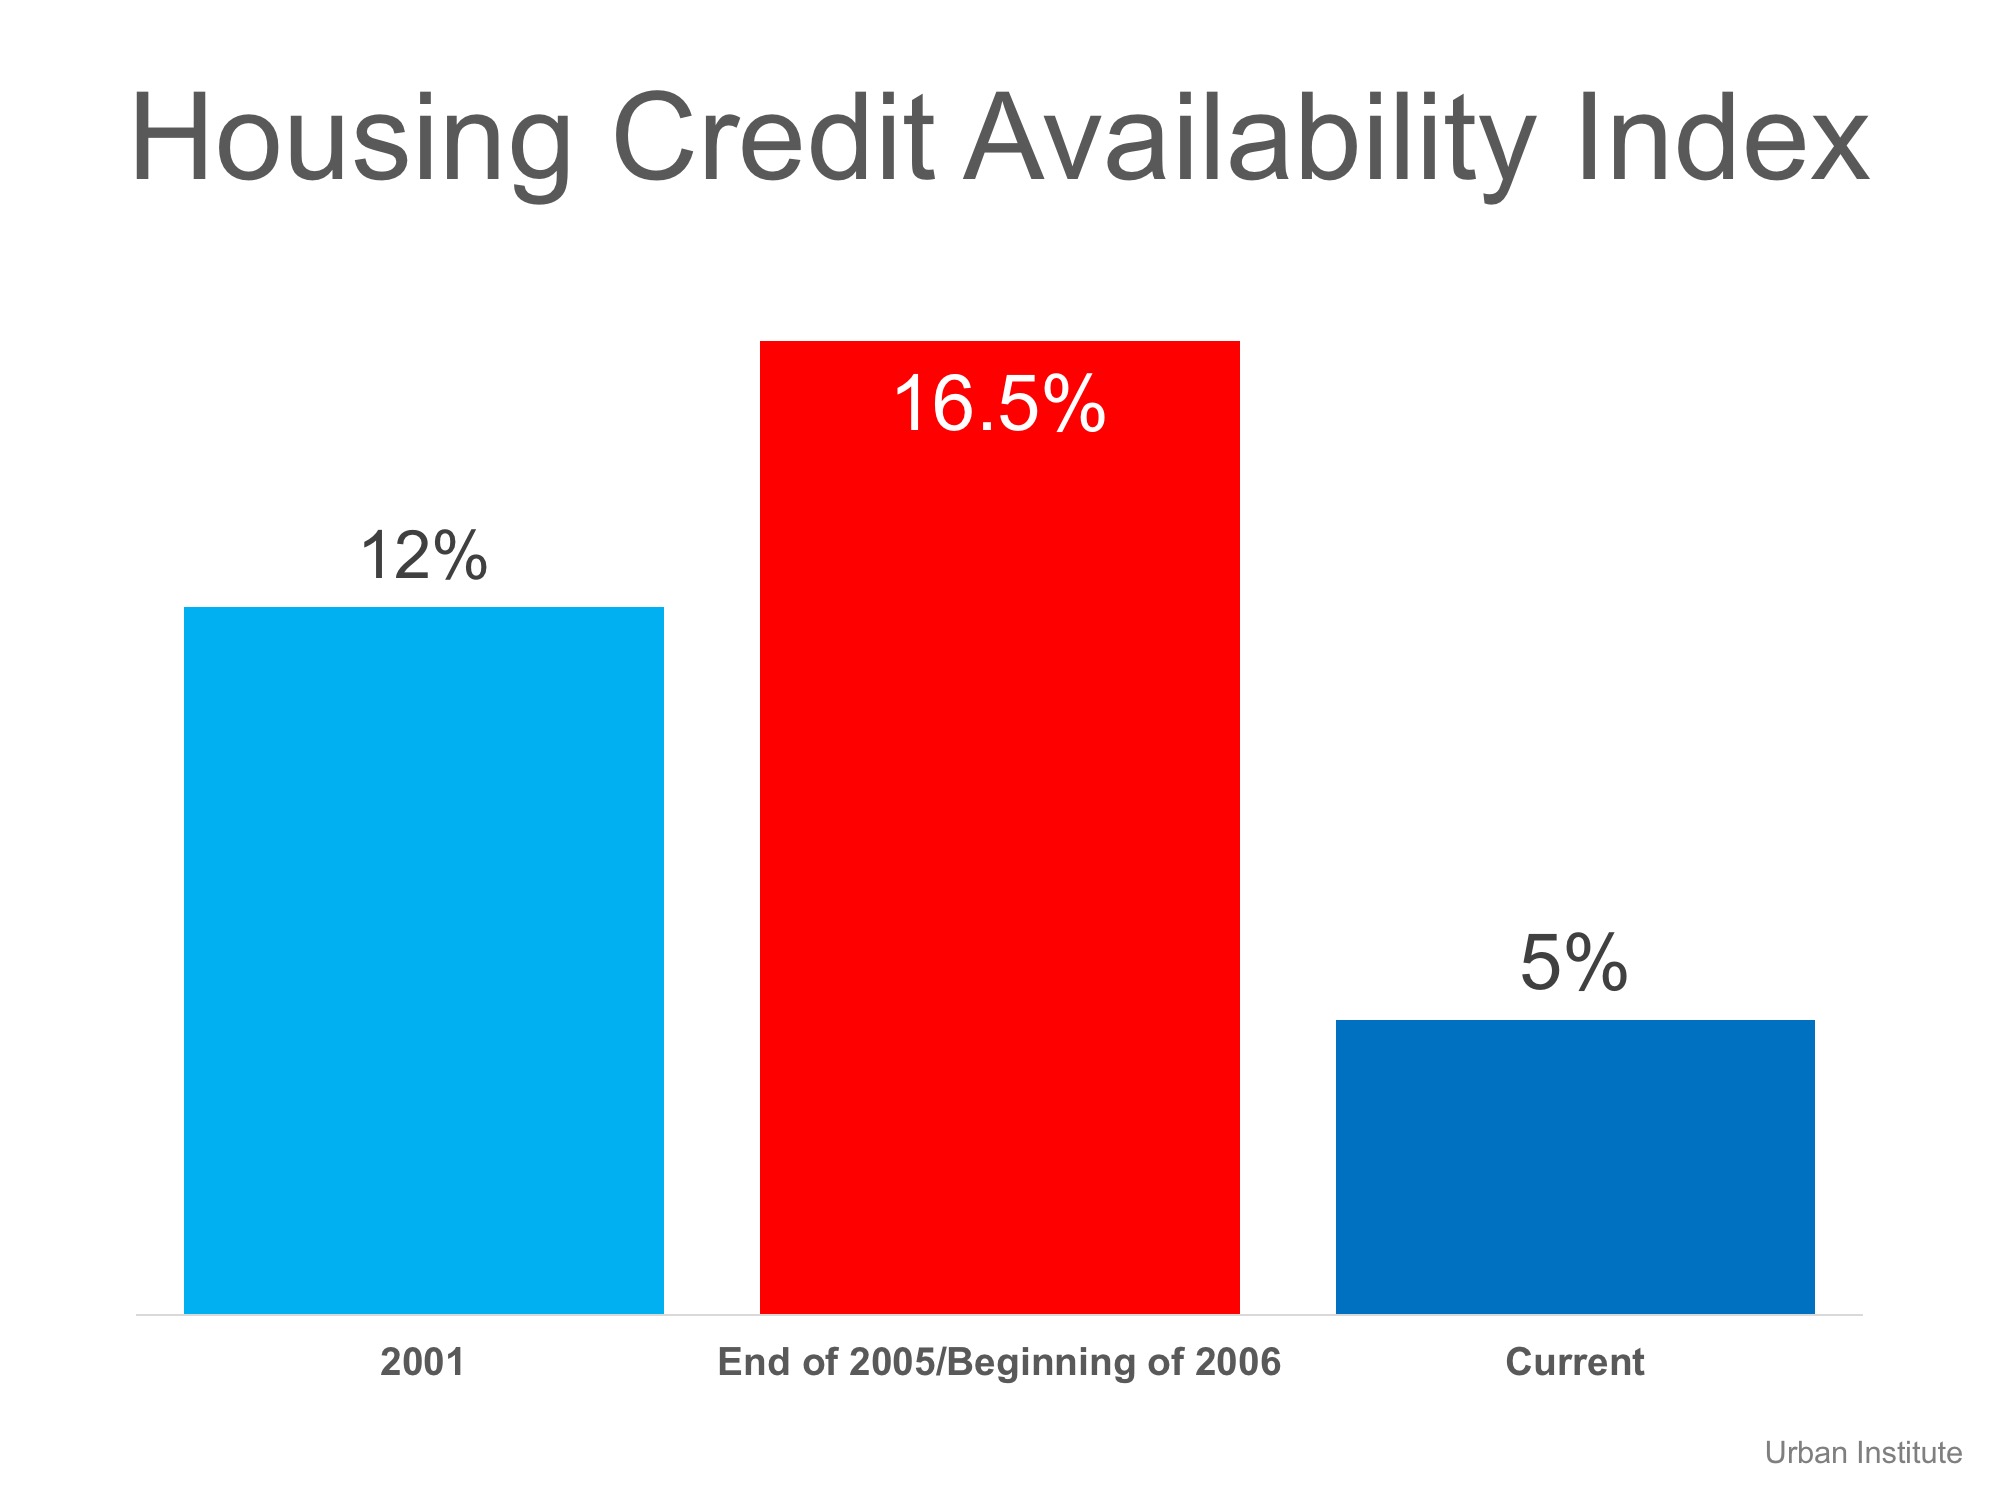
The Urban Institute also publishes a Home Credit Availability Index (HCAI). According to the Institute, the HCAI:

“Measures the percentage of home purchase loans that are likely to default—that is, go unpaid for more than 90 days past their due date. A lower HCAI indicates that lenders are unwilling to tolerate defaults and are imposing tighter lending standards, making it harder to get a loan. A higher HCAI indicates … it is easier to get a loan.”

Here is a graph showing their findings:

Bubble Alert! Is it Getting Too Easy to Get a Mortgage? | Simplifying The Market

Again, today’s lending standards are nowhere near the levels of the boom years. As a matter of fact, they are more stringent than they were even before the boom.

Bottom Line

It is getting easier to gain financing for a home purchase. However, we are not seeing the irresponsible lending that caused the housing crisis.

A Tale of Two Markets: A 6-Month Update

A Tale of Two Markets: A 6-Month Update | Simplifying The Market

Six months ago, we reported that the mismatch between the type of inventory of homes for sale and the demand of buyers in the US was causing the formation of two markets.

In the starter and trade-up home categories, there were significantly more buyers than there were homes for sale, causing a seller’s market. In the premium, or luxury, home categories, the opposite was true as there was a surplus of these homes compared to the buyers that were out searching for their dream homes, which created a buyer’s market.

According to the National Association of Realtors latest Existing Home Sales Report, the inventory of existing homes for sale in today’s market is at a 4.2-month supply. Inventory is now 6.5% lower than this time last year, marking the 27th consecutive month of year-over-year decreases.

Looking at the latest report from Trulia, we can see that not much has changed, and in fact, recent natural disasters across the country have made inventory conditions even more dire.

Trulia’s market mismatch score measures the search interest of buyers against the category of homes that are available on the market. For example: “if 60% of buyers are searching for starter homes but only 40% of listings are starter homes, [the] market mismatch score for starter homes would be 20.”

The results of their latest analysis are detailed in the chart below.

A Tale of Two Markets: A 6-Month Update | Simplifying The Market

Nationally, buyers are searching for starter and trade-up homes and are coming up short with the listings available, which is leading to a highly competitive seller’s market in these categories.

Premium homebuyers, on the other hand, have the best chance of less competition and more inventory of listings in their price range with a 14.7-point surplus, which is creating more of a buyer’s market.

Bottom Line

Real estate is local. If you are thinking about buying OR selling this fall, let’s get together to discuss the exact market conditions in your area.

Which Homes Have Increased in Value the Most?

Which Homes Have Increased in Value the Most? | Simplifying The Market

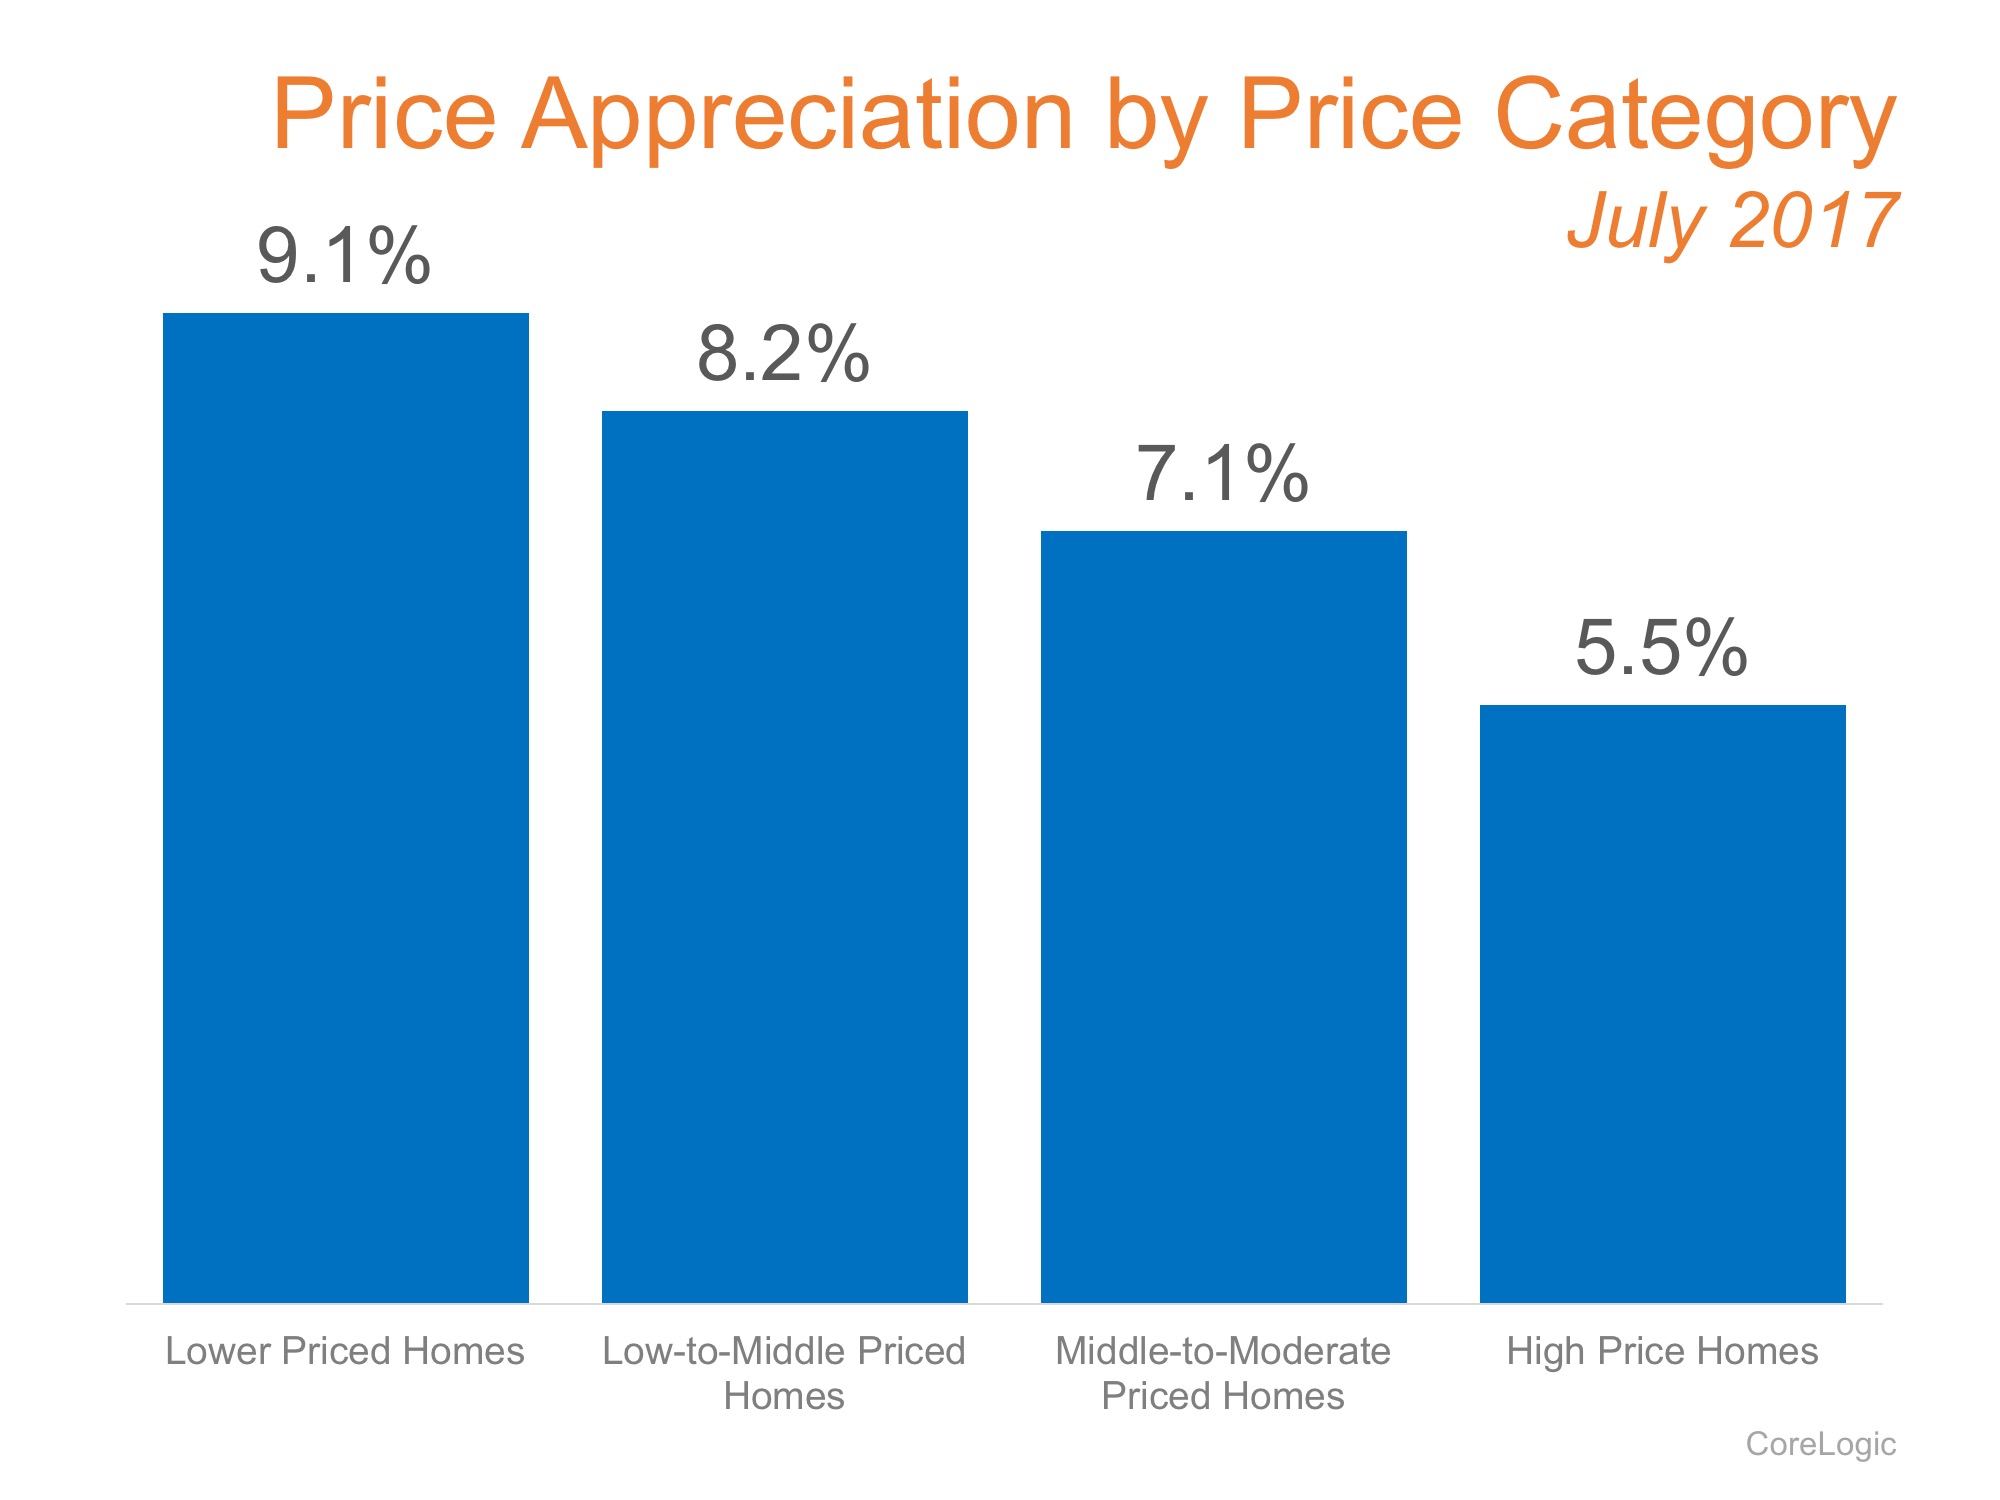
Home values have risen dramatically over the last twelve months. The latest Existing Home Sales Report from the National Association of Realtors puts the annual increase in the median existing-home price at 5.6%. CoreLogic, in their most recent Home Price Index Report, revealed that national home prices have increased by 6.7% year-over-year.

CoreLogic broke appreciation down ever further into four price ranges which gives a more detailed view than simply looking at the year-over-year increases of the national median home price.

The chart below shows the four tiers and each one’s growth from July 2016 to July 2017 (the latest data available).

Which Homes Have Increased in Value the Most? | Simplifying The Market

It is important to pay attention to how prices are changing in your local market. The location of your home is not the only factor in determining how much it has appreciated over the course of the last year. Lower priced homes have appreciated at greater rates than homes at the upper ends of the spectrum, due to demand from first-time home buyers and baby boomers looking to downsize.

Bottom Line

If you are planning on listing your home for sale in today’s market, let’s get together to go over exactly what’s going on in your area and your price range.

Where Are Home Prices Heading in The Next 5 Years?

Where Are the Home Prices Heading in The Next 5 Years? | Simplifying The Market

Today, many real estate conversations center on housing prices and where they may be headed. That is why we like the Home Price Expectation Survey.

Every quarter, Pulsenomics surveys a nationwide panel of over one hundred economists, real estate experts, and investment & market strategists about where they believe prices are headed over the next five years. They then average the projections of all 100+ experts into a single number.

The results of their latest survey:

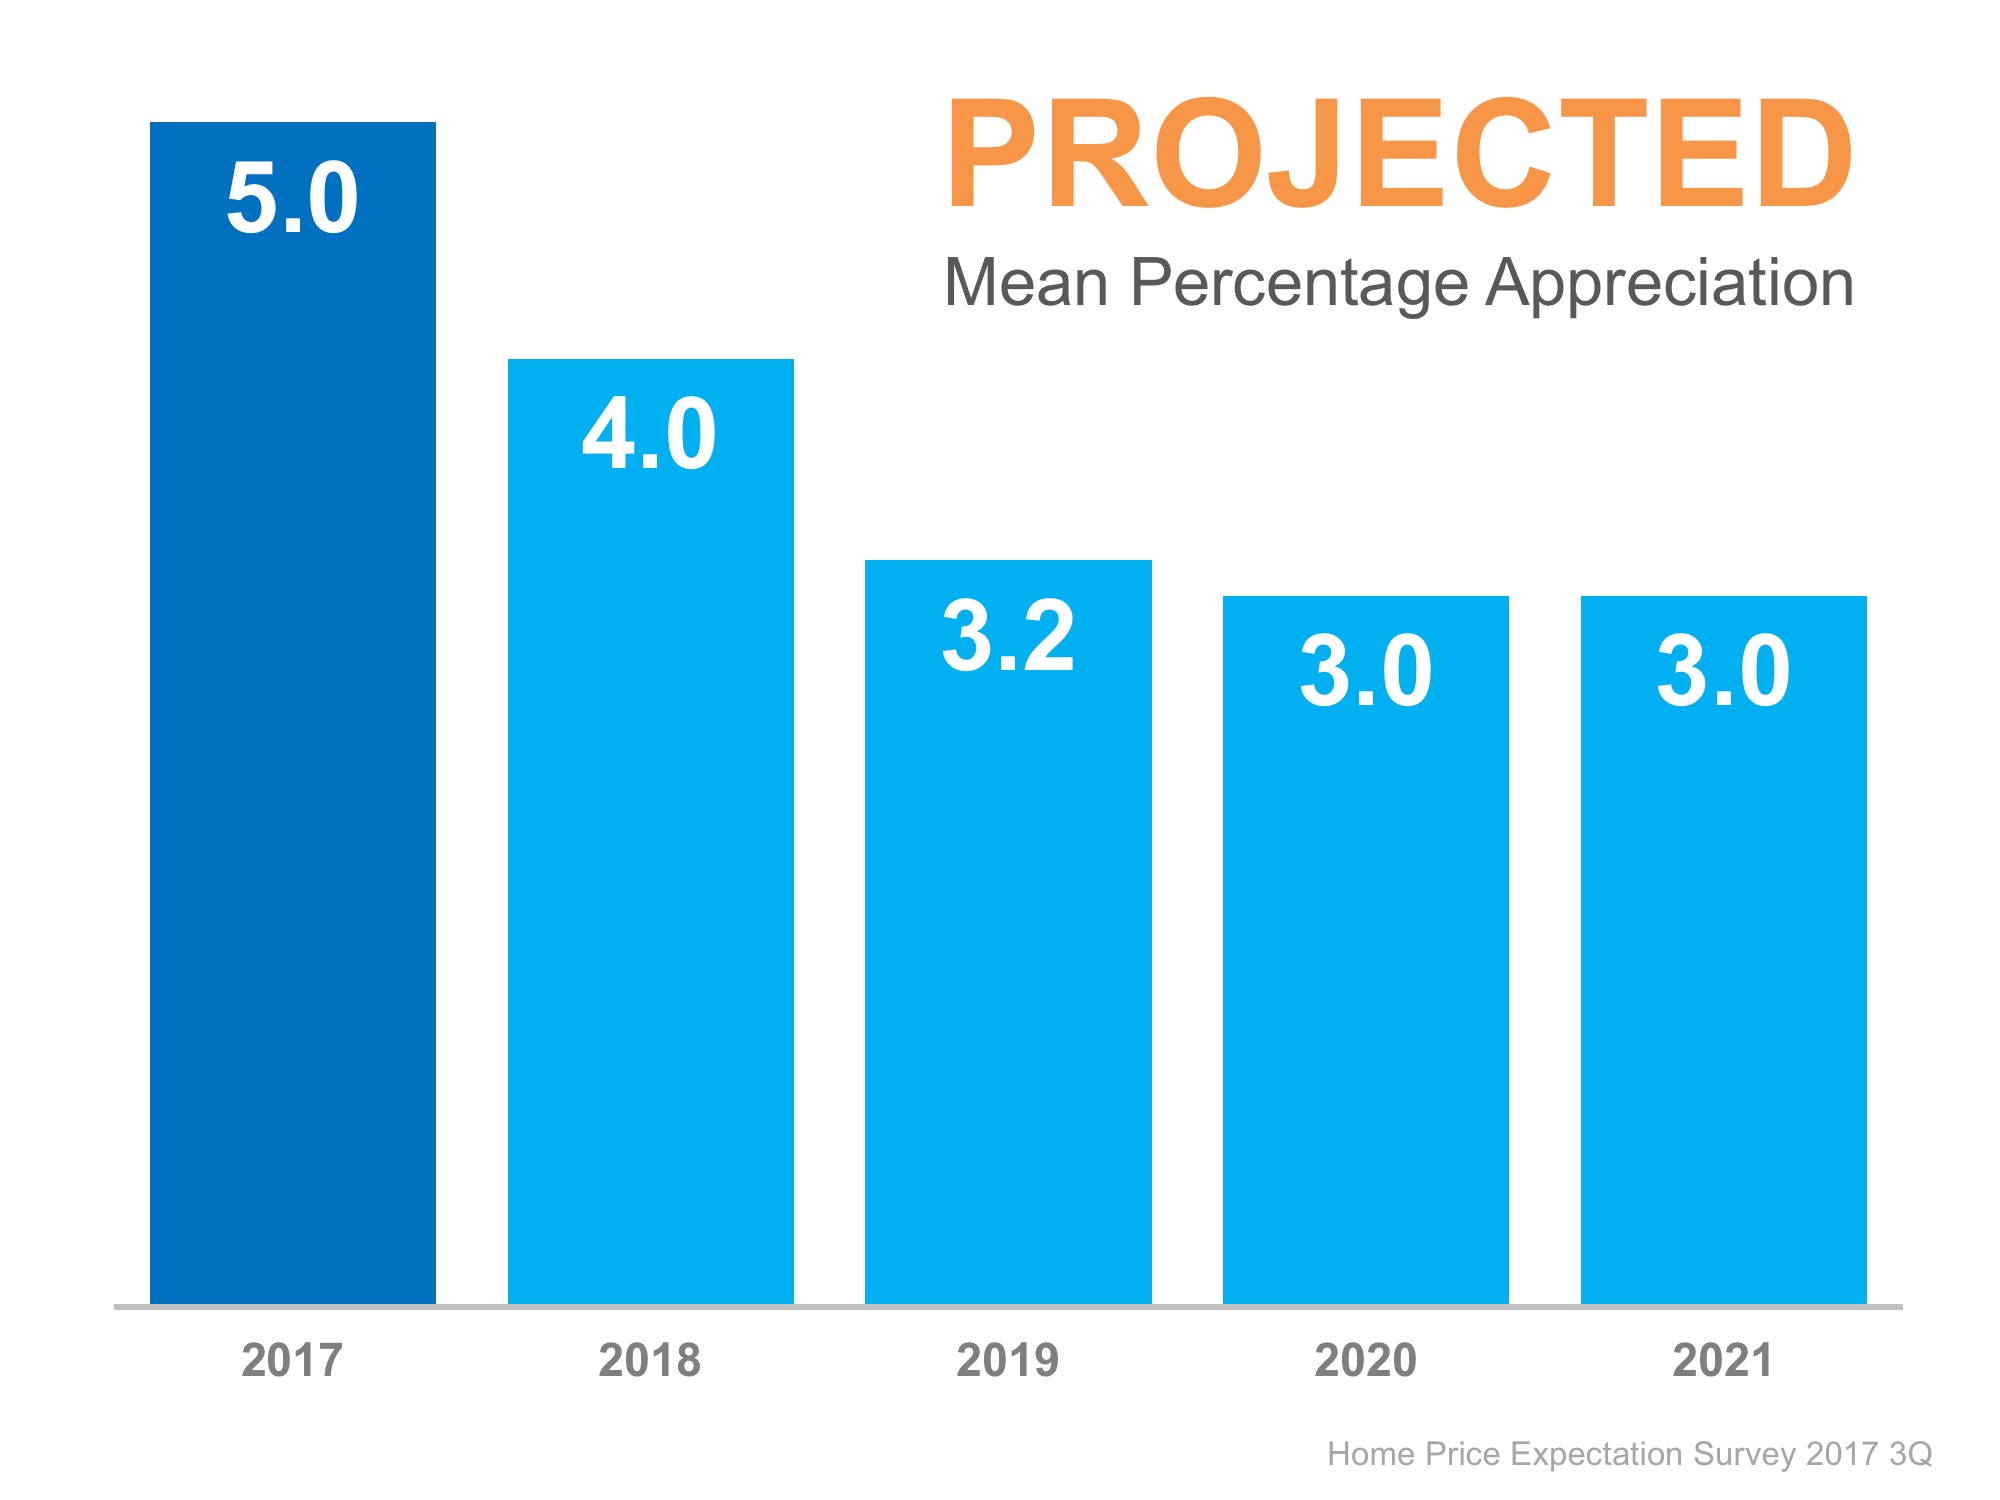
Home values will appreciate by 5.0% over the course of 2017, 4.0% in 2018, 3.2% in 2019, 3.0% in 2020, and 3.0% in 2021. That means the average annual appreciation will be 3.64% over the next 5 years.

Where Are the Home Prices Heading in The Next 5 Years? | Simplifying The Market

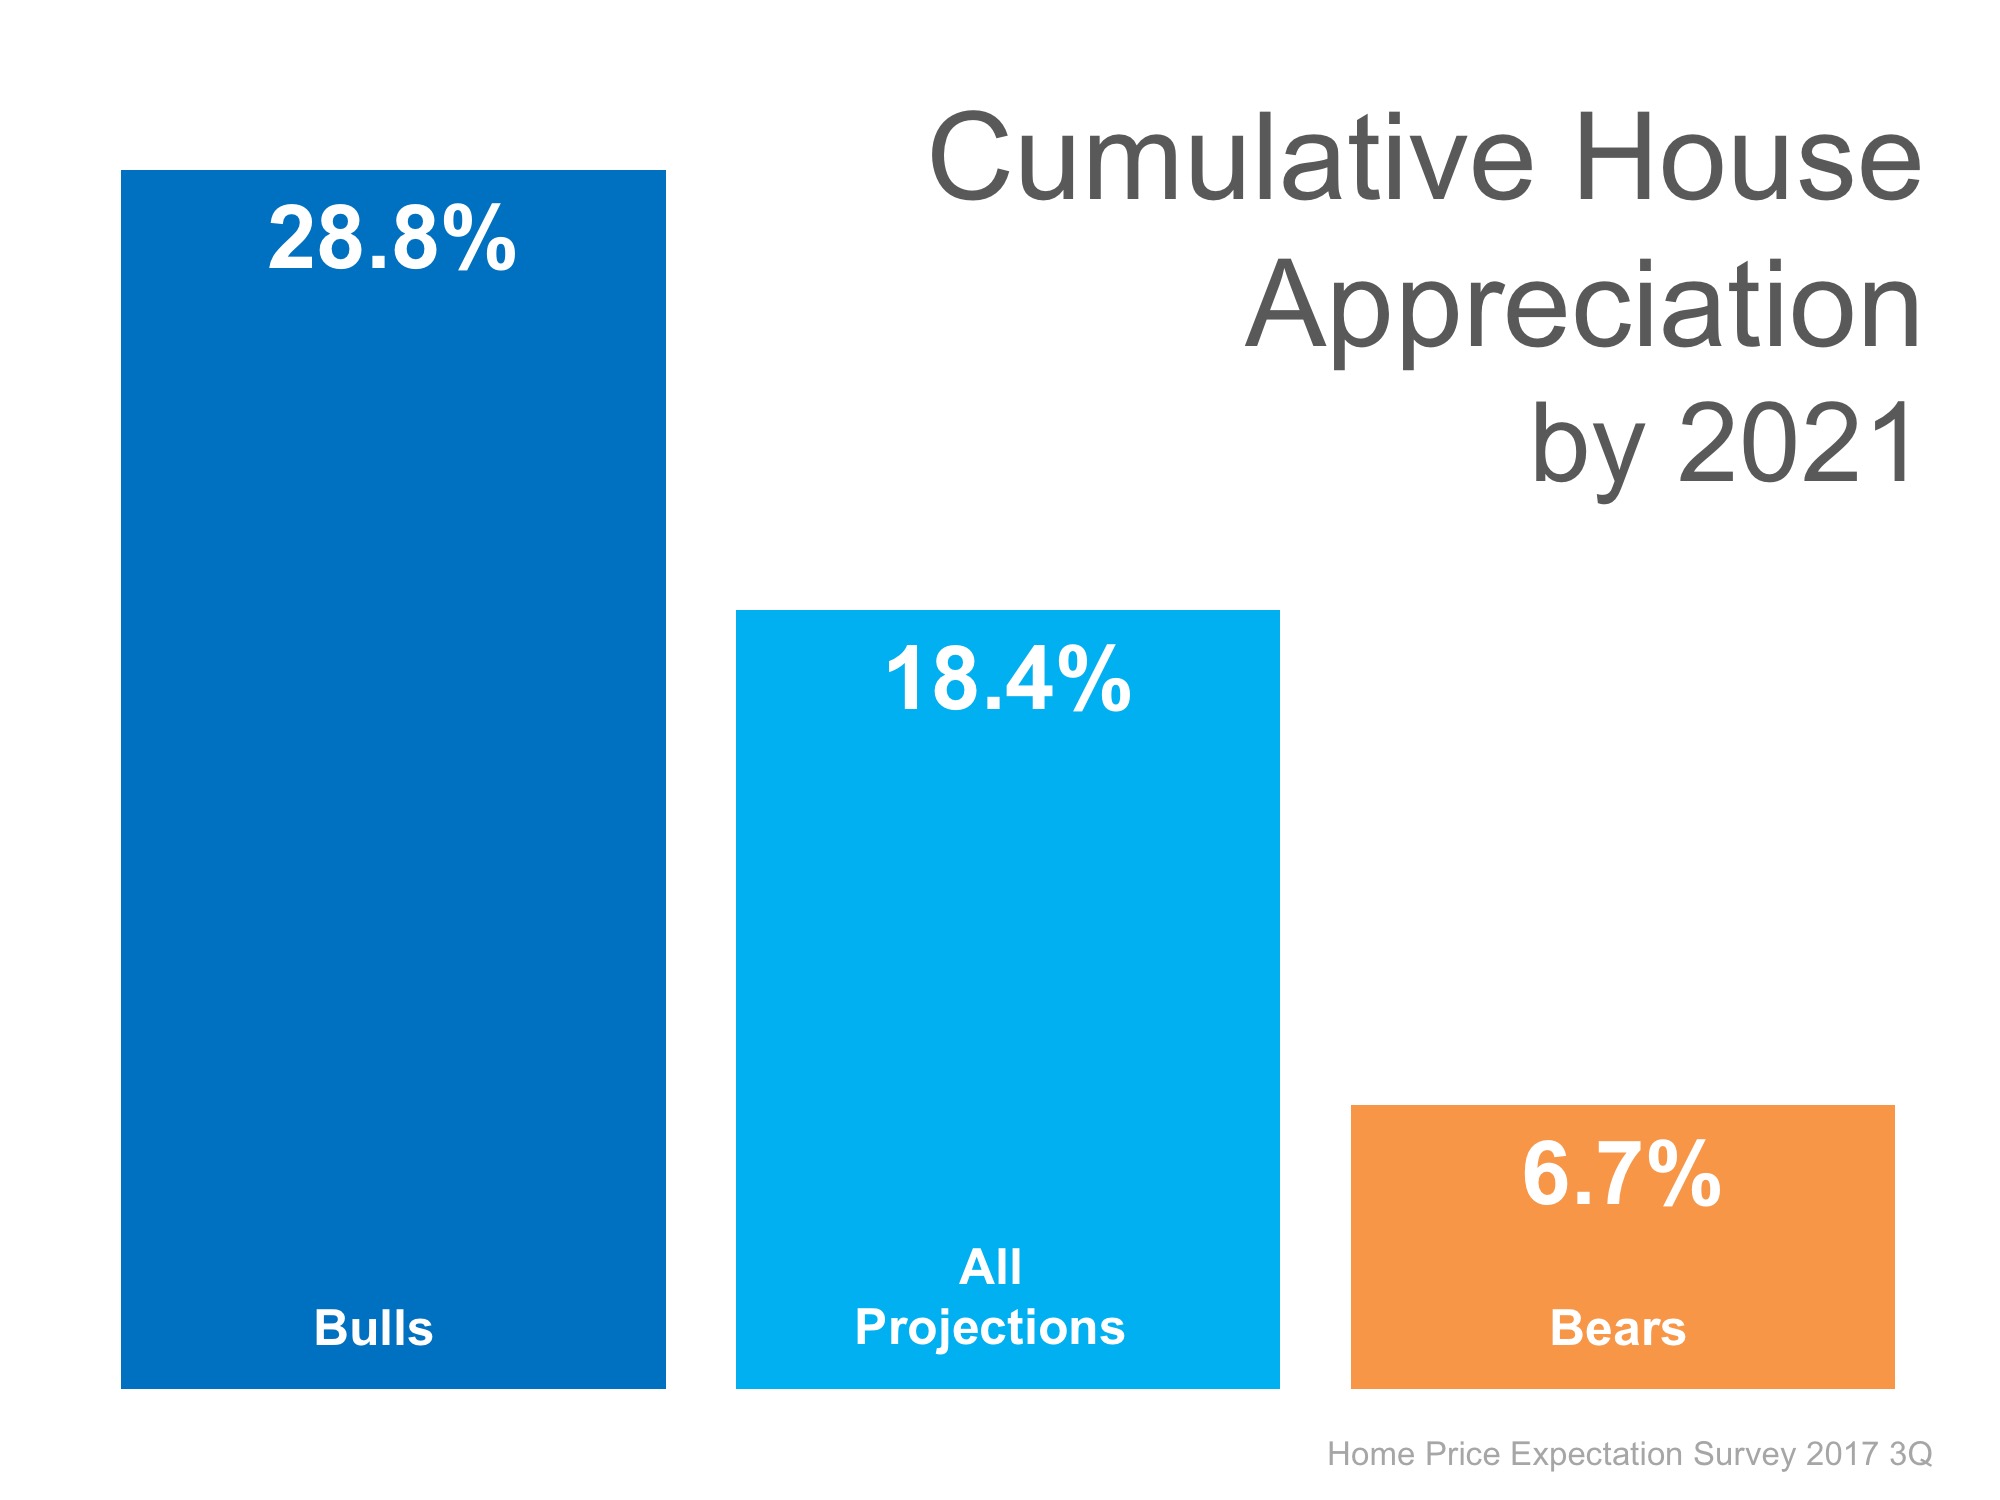
The prediction for cumulative appreciation increased from 17.8% to 18.4% by 2021. The experts making up the most bearish quartile of the survey are projecting a cumulative appreciation of 6.7%.

Where Are the Home Prices Heading in The Next 5 Years? | Simplifying The Market

Bottom Line

Individual opinions make headlines. We believe this survey is a fairer depiction of future values.