Placeholder canvas

Freddie Mac: Rising Mortgage Rates DO NOT Lead to Falling Home Prices

Freddie Mac: Rising Mortgage Rates DO NOT Lead to Falling Home Prices | Simplifying The Market

Recently, Freddie Mac published an Insight Report titled Nowhere to go but up? How increasing mortgage rates could affect housing. The report focused on the impact the projected rise in mortgage rates might have on the housing market this year.

Many believe that an increase in mortgage rates will cause a slowdown in purchases which would, in turn, lead to a fall in house values. Ultimately, however, prices are determined by supply and demand and while rising mortgage rates may slow demand, they also affect supply. From the report:

 “For current homeowners, the decision to buy a new home is typically linked to their decision to sell their current home… Because of this link, the financing costs of the existing mortgage are part of the homeowner’s decision of whether and when to move.

Once financing costs for a new mortgage rise above the rate borrowers are paying for their current mortgage, borrowers would have to give up below-market financing to sell their home.

Instead, they may choose to delay both the sale of their existing home and the purchase of a new home to maintain the advantageous financing.”

The Freddie Mac report, in acknowledging this situation, concluded that prices are not adversely impacted by higher mortgage rates. They explained:

“While there is a drop in the demand for homes, there is an associated drop in the supply of homes from the link between the selling and buying decisions. As both supply and demand move together in this way they have offsetting effects on price—lower demand decreases price and lower supply increases price.

They went on to reveal that the Freddie Mac National House Price Index is…

“…unresponsive to movements in interest rates. In the current housing market, the driving force behind the increase in prices is a low supply of both new and existing homes combined with historically low rates. As mortgage rates increase, the demand for home purchases will likely remain strong relative to the constrained supply and continue to put upward pressure on home prices.”

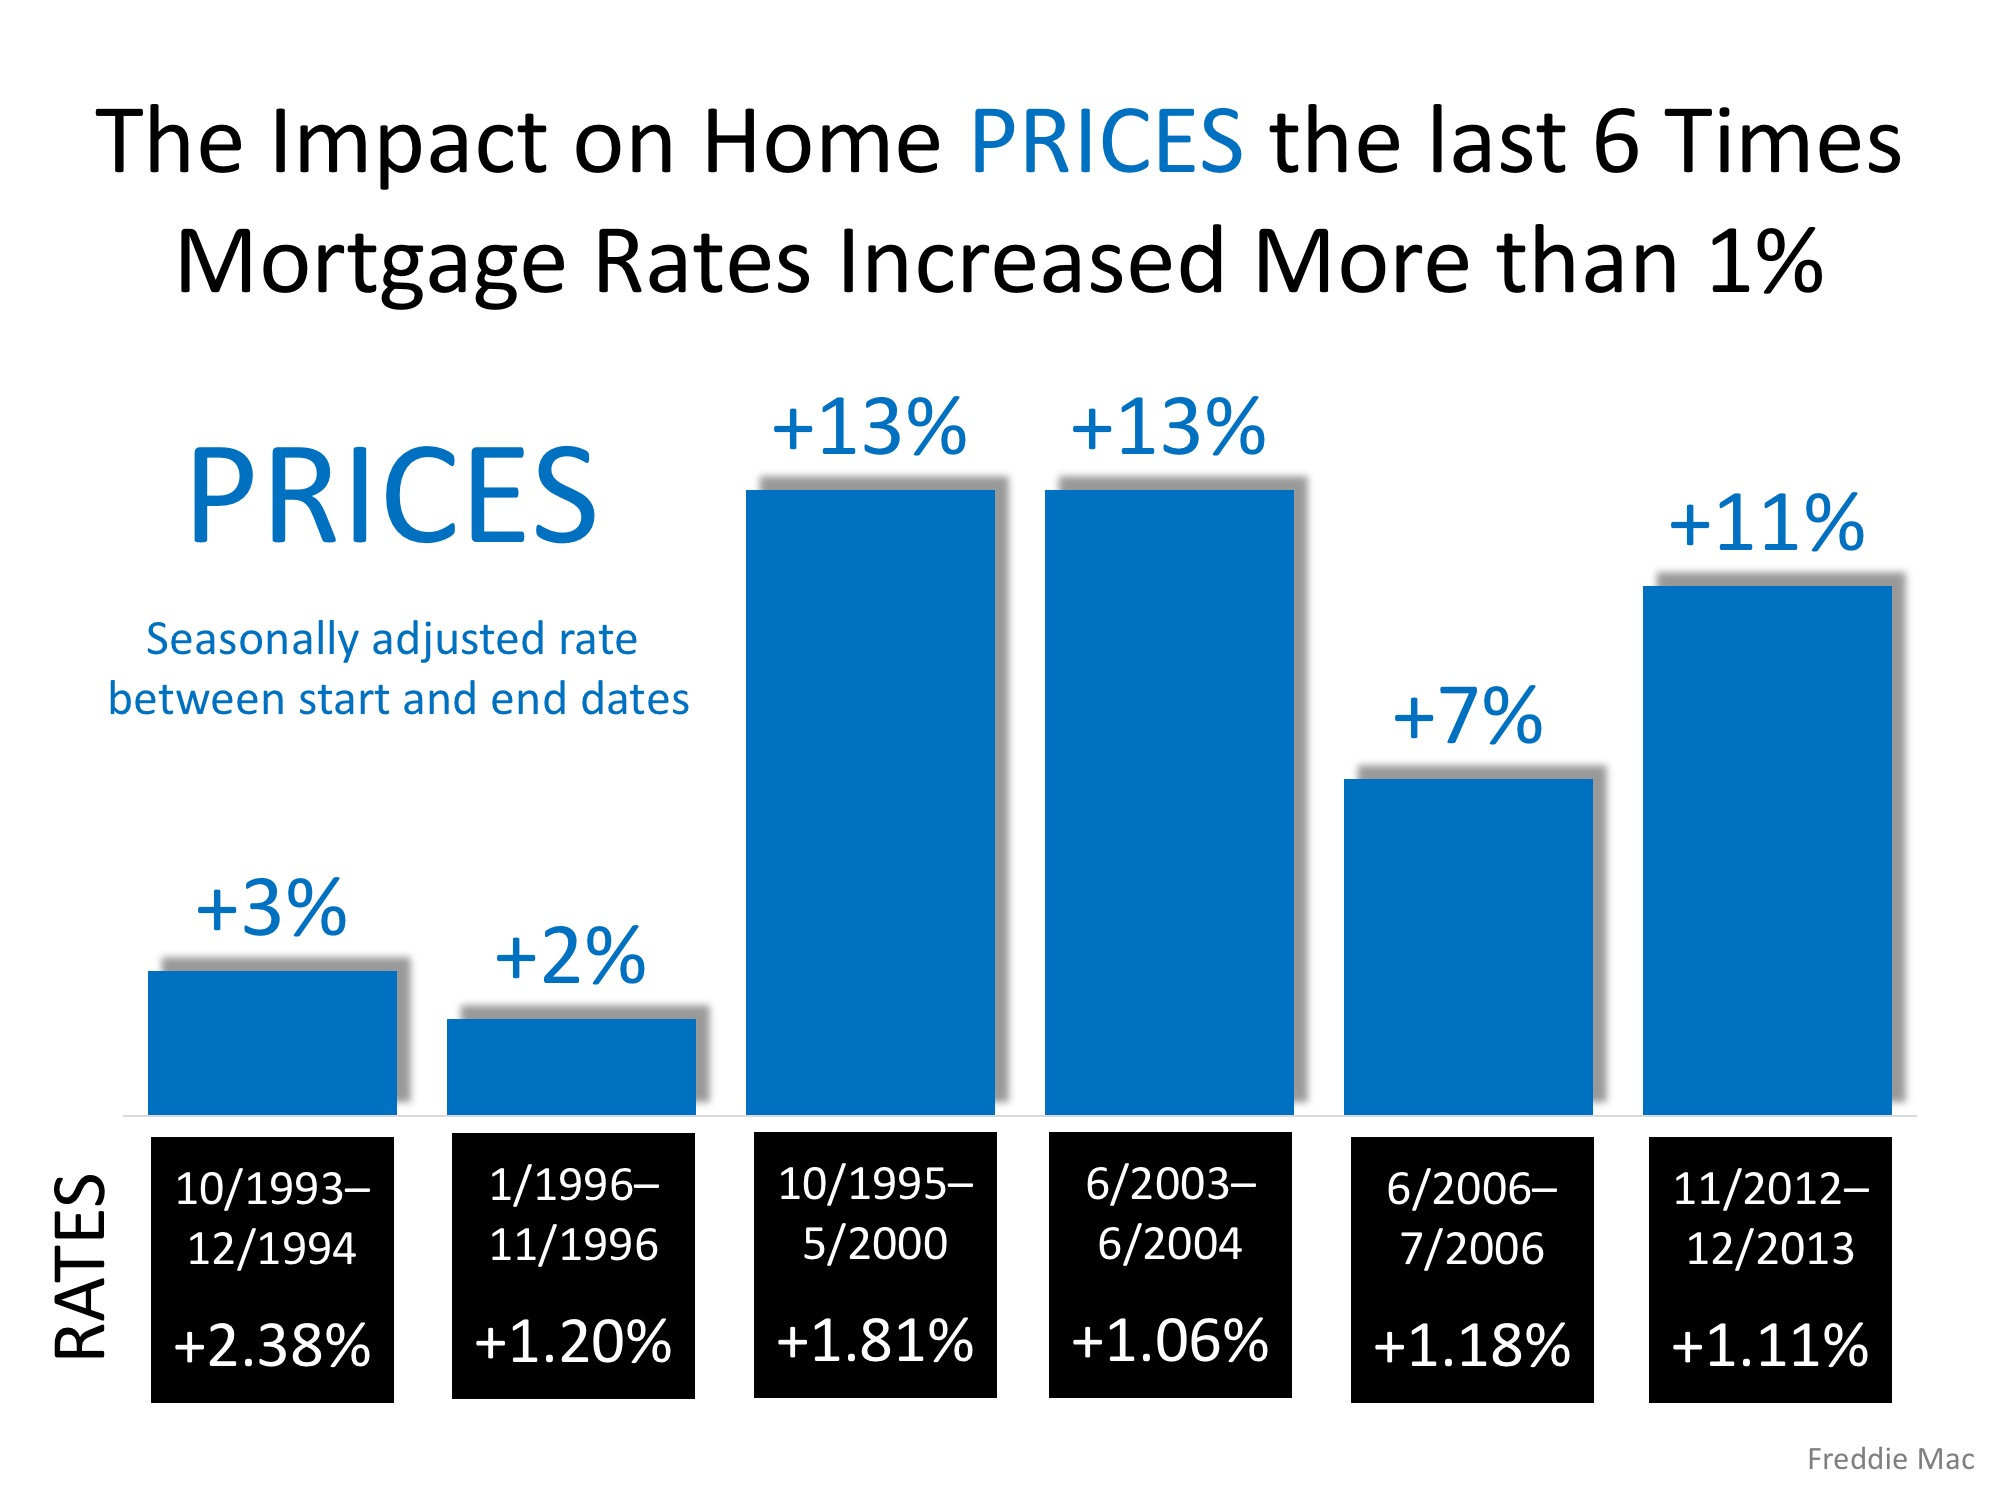
The following graph, based on data from the report, reveals what happened to home prices the last six times mortgage rates rose by at least 1%.

Freddie Mac: Rising Mortgage Rates DO NOT Lead to Falling Home Prices | Simplifying The Market

Bottom Line

Whether you are a move-up buyer or first-time buyer, waiting to purchase your next home based on the belief that prices will fall because of rising mortgage rates makes no sense.

Home Prices: The Difference 5 Years Makes

Home Prices: The Difference 5 Years Makes | Simplifying The Market

The economists at CoreLogic recently released a special report entitled, Evaluating the Housing Market Since the Great Recession. The goal of the report was to look at economic recovery since the Great Recession of December 2007 through June 2009.

One of the key indicators used in the report to determine the health of the housing market was home price appreciation. CoreLogic focused on appreciation from December 2012 to December 2017 to show how prices over the last five years have fared.

Frank Nothaft, Chief Economist at CoreLogic, commented on the importance of breaking out the data by state,

“Homeowners in the United States experienced a run-up in prices from the early 2000s to 2006, and then saw the trend reverse with steady declines through 2011. After finally reaching bottom in 2011, home prices began a slow rise back to where we are now.

Greater demand and lower supply – as well as booming job markets – have given some of the hardest-hit housing markets a boost in home prices. Yet, many are still not back to pre-crash levels.”

The map below was created to show the 5-year appreciation from December 2012 – December 2017 by state.

Home Prices: The Difference 5 Years Makes | Simplifying The Market

Nationally, the cumulative appreciation over the five-year period was 37.4%, with a high of 66% in Nevada, and a modest increase of 5% in Connecticut.

Where were prices expected to go?

Every quarter, Pulsenomics surveys a nationwide panel of over 100 economists, real estate experts, and investment and market strategists and asks them to project how residential home prices will appreciate over the next five years for their Home Price Expectation Survey (HPES).

According to the December 2012 survey results, national homes prices were projected to increase cumulatively by 23.1% by December 2017. The bulls of the group predicted home prices to rise by 33.6%, while the more cautious bears predicted an appreciation of 11.2%.

Where are prices headed in the next 5 years?

Data from the most recent HPES shows that home prices are expected to increase by 18.2% over the next 5 years. The bulls of the group predict home prices to rise by 27.4%, while the more cautious bears predict an appreciation of 8.3%.

Bottom Line

Every day, thousands of homeowners regain positive equity in their homes. Some homeowners are now experiencing values even higher than before the Great Recession. If you’re wondering if you have enough equity to sell your house and move on to your dream home, let’s get together to discuss conditions in our neighborhood!

Are Home Values Really Overinflated?

Are Home Values Really Overinflated? | Simplifying The Market

Last week, the National Association of Realtors (NAR) released their most recent Existing Home Sales Report. According to the report:

“The median existing-home price for all housing types in January was $240,500, up 5.8 percent from January 2017 ($227,300). January’s price increase marks the 71st straight month of year-over-year gains.”

Seventy-one consecutive months of price increases may have some concerned that current home values may be overinflated.

However, at the same time, Zillow issued a press release which revealed:

“If the housing bubble and bust had not happened, and home values had instead appreciated at a steady pace, the median home value would be higher than its current value.”

Here are two graphs that help show why home prices are exactly where they should be.

The first graph shows actual median home sales prices from 2000 through 2017.

Are Home Values Really Overinflated? | Simplifying The Market

By itself, this graph could heighten concerns as it shows home values rose in the early 2000s, came tumbling down and are now headed up again. It gives the feel of a rollercoaster ride that is about to take another turn downward.

However, if we also include where prices would naturally be, had there not been a boom & bust, we see a different story.

Are Home Values Really Overinflated? | Simplifying The Market

The blue bars on this graph represent were prices would be if they had increased by the normal annual appreciation rate (3.6%). By adding 3.6% to the actual 2000 price and repeating that for each subsequent year, we can see that prices were overvalued during the boom, undervalued during the bust, and a little bit LOWER than where they should be right now.

Bottom Line

Based on historic appreciation levels, we should be very comfortable that current home values are not overinflated.

Mortgage Rates on FIRE! Home Prices Up in Smoke?

Mortgage Rates on FIRE! Home Prices Up in Smoke? | Simplifying The Market

Mortgage interest rates have already risen by over a quarter of a percentage point in 2018. Many are projecting that rates could increase to 5% by the end of the year.

What impact will rising rates have on house values?

Many quickly jump to the conclusion that an increase in mortgage rates will have a detrimental impact on real estate prices as fewer buyers will be able to qualify for a loan. This seems logical; if there is less demand for housing then prices will drop.

However, in a good economy, rising mortgage rates increase demand as many prospective purchasers immediately jump off the fence to guarantee they get the lower rate.

Let’s look at home prices the last four times mortgage rates increased dramatically.

Mortgage Rates on FIRE! Home Prices Up in Smoke? | Simplifying The Market

In each case, home prices APPRECIATED and did not depreciate. No one is projecting as dramatic an increase in rates as the examples above. Most are projecting an increase of approximately 1% by the end of the year.

The last time mortgage rates increased by 1% over a twelve-month period was January 2013 (3.41%) to January 2014 (4.43%). What happened to house prices during that span? They appreciated by 9.8%.

Just two weeks ago, Rick Palacios Jr., Director of Research at John Burns Real Estate Consulting explained:

“Mortgage rates have risen 1% or more ten times in the last 43 years, with little impact on home sales and prices when the economy was also strong…Historically, rising confidence, solid job growth, and higher wages have more than offset reduced demand for housing resulting from higher mortgage rates.”

Bottom Line

When mortgage rates increase, history has shown that prices appreciate (and do not depreciate) during that same time span.

2 Ways to Get the Most Money from The Sale of Your Home

2 Ways to Get the Most Money from The Sale of Your Home | Simplifying The Market

Every homeowner wants to make sure they maximize their financial reward when selling their home. But how do you guarantee that you receive the maximum value for your house?

Here are two keys to ensure that you get the highest price possible.

1. Price it a LITTLE LOW 

This may seem counterintuitive, but let’s look at this concept for a moment. Many homeowners think that pricing their homes a little OVER market value will leave them with room for negotiation. In actuality, this just dramatically lessens the demand for your house (see chart below).

2 Ways to Get the Most Money from The Sale of Your Home | Simplifying The Market

Instead of the seller trying to ‘win’ the negotiation with one buyer, they should price it so that demand for the home is maximized. By doing this, the seller will not be fighting with a buyer over the price but will instead have multiple buyers fighting with each other over the house.

Realtor.com gives this advice:

“Aim to price your property at or just slightly below the going rate. Today’s buyers are highly informed, so if they sense they’re getting a deal, they’re likely to bid up a property that’s slightly underpriced, especially in areas with low inventory.”

2. Use a Real Estate Professional

This, too, may seem counterintuitive. The seller may think they would make more money if they didn’t have to pay a real estate commission. With this being said, studies have shown that homes typically sell for more money when handled by a real estate professional.

study by Collateral Analytics, reveals that FSBOs don’t actually save any money, and in some cases may be costing themselves more, by not listing with an agent.

In the study, they analyzed home sales in a variety of markets in 2016 and the first half of 2017. The data showed that:

“FSBOs tend to sell for lower prices than comparable home sales, and in many cases below the average differential represented by the prevailing commission rate.”

The results of the study showed that the differential in selling prices for FSBOs when compared to MLS sales of similar properties is about 5.5%. Sales in 2017 suggest the average price was near 6% lower for FSBO sales of similar properties.

Bottom Line

Price your house at or slightly below the current market value and hire a professional. This will guarantee that you maximize the price you get for your house.

Should I Wait Until Next Year to Buy? Or Buy Now? [INFOGRAPHIC]

Should I Wait until next Year to Buy? Or Buy Now? [INFOGRAPHIC] | Simplifying The Market

Some Highlights:

  • The Cost of Waiting to Buy is defined as the additional funds it would take to buy a home if prices & interest rates were to increase over a period of time.
  • Freddie Mac predicts interest rates to rise to 5.1% by 2019.
  • CoreLogic predicts home prices to appreciate by 4.3% over the next 12 months.
  • If you are ready and willing to buy your dream home, find out if you are able to!

Low Inventory Pushes Home Prices Higher

Low Inventory Pushes Home Prices Higher | Simplifying The Market

According to CoreLogic’s latest Home Price Index, prices appreciated by 6.9% year-over-year from December 2016 to December 2017 on a national level. This marks the fifth month in a row with at least a 6.9% increase.

Dr. Frank Nothaft, Chief Economist for CoreLogic, gave insight into the reason behind the large appreciation,

“The number of homes for sale has remained very low. Job growth lowered the unemployment rate to 4.1 percent by year’s end, the lowest level in 17 years. Rising income and consumer confidence has increased the number of prospective homebuyers. The net result of rising demand and limited for-sale inventory is a continued appreciation in home prices.”

This is great news for homeowners who have gained nearly $15,000 in equity (on average) in their homes over the last year! Those homeowners who had been on the fence as to whether or not to sell will be pleasantly surprised to find out that they now have an even larger profit to help cover a down payment on their dream homes.

As we near the traditionally busy spring buyers season, there is still hope for buyers as mortgage rates remain low compared to recent decades. The report also predicted that home price appreciation will slow slightly, rising by 4.3% by this time next year.

Bottom Line

If you are looking to enter the housing market, as either a buyer or a seller, let’s get together to go over exactly what’s going on in our neighborhood and discuss your options!

Bidding Wars Abound… How Long Will They Continue?

Bidding Wars Abound… How Long Will They Continue? | Simplifying The Market

Just like with any product or service, the law of supply and demand impacts home prices. Any time that there is less supply than the market demands, prices increase.

In many areas of the country, the supply of homes for sale in the starter and trade-up home markets is so low that bidding wars have ensued, and the busy spring-buying season is just around the corner.

CoreLogic recently conducted an analysis on national home prices at the time of sale for their January 2018 MarketPulse Report and found that a third of homes sold for at least list price.

“The share selling above list price was almost three times the trough in January 2008 and represented more than one-fifth of total sales.”

Many markets in the western part of the country and around major cities are experiencing higher shares of homes selling above list price.

“San Francisco had the largest share of homes—76 percent—that sold for at least the list price, and Seattle and Los Angeles followed with 63 and 51 percent, respectively. Miami had the lowest share—16 percent—of homes selling at or above the list price.”

Increased demand during the spring and summer months, the traditionally busier seasons for real estate, will no doubt influence how many homes continue to sell over list price.

This should not be seen by sellers as permission to overprice their homes, though. Buyers are becoming more and more educated, especially those who have been searching for their dream homes for a while now while waiting for new inventory to come to market.

Realtor.com gives this advice:

“Aim to price your property at or just slightly below the going rate. Today’s buyers are highly informed, so if they sense they’re getting a deal, they’re likely to bid up a property that’s slightly underpriced, especially in areas with low inventory.”

Bottom Line

Without a large wave of new listings coming to market, buyers will continue competing with each other for the homes that are available. If you are thinking of selling your home, now may be the time to do so before more competition comes this spring. Let’s get together to determine the demand for your house in our area.

Gap Between Homeowners & Appraisers Narrows to Lowest Mark in 2 Years

Gap Between Homeowners & Appraisers Narrows to Lowest Mark in 2 Years | Simplifying The Market

In today’s housing market, where supply is very low and demand is very high, home values are increasing rapidly. Many experts are projecting that home values could appreciate by another 4% or more over the next twelve months. One major challenge in such a market is the bank appraisal.

When prices are surging, it is difficult for appraisers to find adequate, comparable sales (similar houses in the neighborhood that recently closed) to defend the selling price when performing the appraisal for the bank.

Every month in their Home Price Perception Index (HPPI), Quicken Loans measures the disparity between what a homeowner who is seeking to refinance their home believes their house is worth and what an appraiser’s evaluation of that same home is.

In the latest release, the disparity was the narrowest it has been in over two years, as the gap between appraisers and homeowners was only -0.5%. This is important for homeowners to note as even a .5% difference in appraisal can mean thousands of dollars that a buyer or seller would have to come up with at closing (depending on the price of the home)

The chart below illustrates the changes in home price estimates over the last two years.

Gap Between Homeowners & Appraisers Narrows to Lowest Mark in 2 Years | Simplifying The Market

Bill Banfield, Executive VP of Capital Markets at Quicken Loans urges homeowners to find out how their local markets have been impacted by supply and demand:

“Appraisers and real estate professionals evaluate their local housing markets daily. Homeowners, on the other hand, may only think about their housing market when they see ‘for sale’ signs hit front yards in the spring or when they think about accessing their equity.”

“With several years of growth, owners may have more equity than they realize. Many consumers use the tax season at the beginning of the year to reevaluate their entire financial life. It also provides a good opportunity for them to consider how best to take advantage of their equity while mortgage interest rates and borrowing costs are still near record lows.”

Bottom Line 

Every house on the market must be sold twice; once to a prospective buyer and then to the bank (through the bank’s appraisal). With escalating prices, the second sale might be even more difficult than the first. If you are planning on entering the housing market this year, let’s get together to discuss this and any other obstacles that may arise.

What Impact Will the New Tax Code Have on Home Values?

Every month, CoreLogic releases its Home Price Insights Report. In that report, they forecast where they believe residential real estate prices will be in twelve months.

Below is a map, broken down by state, reflecting how home values are forecasted to change by the end of 2018 using data from the most recent report.

What Impact Will the New Tax Code Have on Home Values? | Simplifying The Market

As we can see, CoreLogic projects an increase in home values in 49 of 50 states, and Washington, DC (there was insufficient data for HI). Nationwide, they see home prices increasing by 4.2%.

How might the new tax code impact these numbers?

Recently, the National Association of Realtors (NAR) conducted their own analysis to determine the impact the new tax code may have on home values. NAR’s analysis:

“…estimated how home prices will change in the upcoming year for each state, considering the impact of the new tax law and the momentum of jobs and housing inventory.”

Here is a map based on NAR’s analysis:

What Impact Will the New Tax Code Have on Home Values? | Simplifying The Market

Bottom Line

According to NAR, the new tax code will have an impact on home values across the country. However, the effect will be much less significant than what some originally thought.